Orientation-selective adaptation to illusory contours in human visual cortex
- PMID: 17329415
- PMCID: PMC2728022
- DOI: 10.1523/JNEUROSCI.4173-06.2007
Orientation-selective adaptation to illusory contours in human visual cortex
Abstract
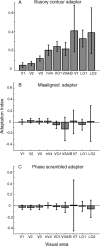
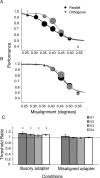
Humans can perceive illusory or subjective contours in the absence of any real physical boundaries. We used an adaptation protocol to look for orientation-selective neural responses to illusory contours defined by phase-shifted abutting line gratings in the human visual cortex. We measured functional magnetic resonance imaging (fMRI) responses to illusory-contour test stimuli after adapting to an illusory-contour adapter stimulus that was oriented parallel or orthogonal to the test stimulus. We found orientation-selective adaptation to illusory contours in early (V1 and V2) and higher-tier visual areas (V3, hV4, VO1, V3A/B, V7, LO1, and LO2). That is, fMRI responses were smaller for test stimuli parallel to the adapter than for test stimuli orthogonal to the adapter. In two control experiments using spatially jittered and phase-randomized stimuli, we demonstrated that this adaptation was not just in response to differences in the distribution of spectral power in the stimuli. Orientation-selective adaptation to illusory contours increased from early to higher-tier visual areas. Thus, both early and higher-tier visual areas contain neurons selective for the orientation of this type of illusory contour.
Figures


Comment in
-
Seeing things: illusory contours in the human visual brain.J Neurosci. 2007 May 16;27(20):5269-70. doi: 10.1523/JNEUROSCI.1126-07.2007. J Neurosci. 2007. PMID: 17507549 Free PMC article. Review. No abstract available.
Similar articles
-
Orientation-selective adaptation to first- and second-order patterns in human visual cortex.J Neurophysiol. 2006 Feb;95(2):862-81. doi: 10.1152/jn.00668.2005. Epub 2005 Oct 12. J Neurophysiol. 2006. PMID: 16221748 Free PMC article. Clinical Trial.
-
Orientation selectivity of motion-boundary responses in human visual cortex.J Neurophysiol. 2010 Dec;104(6):2940-50. doi: 10.1152/jn.00400.2010. Epub 2010 Sep 22. J Neurophysiol. 2010. PMID: 20861432 Free PMC article.
-
Top-Down Feedback Controls the Cortical Representation of Illusory Contours in Mouse Primary Visual Cortex.J Neurosci. 2020 Jan 15;40(3):648-660. doi: 10.1523/JNEUROSCI.1998-19.2019. Epub 2019 Dec 2. J Neurosci. 2020. PMID: 31792152 Free PMC article.
-
The representation of illusory and real contours in human cortical visual areas revealed by functional magnetic resonance imaging.J Neurosci. 1999 Oct 1;19(19):8560-72. doi: 10.1523/JNEUROSCI.19-19-08560.1999. J Neurosci. 1999. PMID: 10493756 Free PMC article.
-
Why do parallel cortical systems exist for the perception of static form and moving form?Percept Psychophys. 1991 Feb;49(2):117-41. doi: 10.3758/bf03205033. Percept Psychophys. 1991. PMID: 2017350 Review.
Cited by
-
Equivalent representation of real and illusory contours in macaque V4.J Neurosci. 2012 May 16;32(20):6760-70. doi: 10.1523/JNEUROSCI.6140-11.2012. J Neurosci. 2012. PMID: 22593046 Free PMC article.
-
Retinotopic activation in response to subjective contours in primary visual cortex.Front Hum Neurosci. 2008 Apr 3;2:2. doi: 10.3389/neuro.09.002.2008. eCollection 2008. Front Hum Neurosci. 2008. PMID: 18958203 Free PMC article.
-
Representation of illusory and physical rotations in human MST: A cortical site for the pinna illusion.Hum Brain Mapp. 2016 Jun;37(6):2097-113. doi: 10.1002/hbm.23156. Epub 2016 Mar 4. Hum Brain Mapp. 2016. PMID: 26945511 Free PMC article.
-
Receptive field focus of visual area V4 neurons determines responses to illusory surfaces.Proc Natl Acad Sci U S A. 2013 Oct 15;110(42):17095-100. doi: 10.1073/pnas.1310806110. Epub 2013 Oct 1. Proc Natl Acad Sci U S A. 2013. PMID: 24085849 Free PMC article.
-
A comparison of fMRI adaptation and multivariate pattern classification analysis in visual cortex.Neuroimage. 2010 Jan 15;49(2):1632-40. doi: 10.1016/j.neuroimage.2009.09.066. Epub 2009 Oct 6. Neuroimage. 2010. PMID: 19815081 Free PMC article.
References
-
- Aguirre GK, Zarahn E, D'Esposito M. The variability of human, BOLD hemodynamic responses. NeuroImage. 1998;8:360–369. - PubMed
-
- Bandettini PA, Jesmanowicz A, Wong EC, Hyde JS. Processing strategies for time-course data sets in functional MRI of the human brain. Magn Reson Med. 1993;30:161–173. - PubMed
-
- Brainard DH. The psychophysics toolbox. Spat Vis. 1997;10:433–436. - PubMed
-
- Brefczynski JA, DeYoe EA. A physiological correlate of the “spotlight” of visual attention. Nat Neurosci. 1999;2:370–374. - PubMed
-
- Chaudhuri A. Modulation of the motion aftereffect by selective attention. Nature. 1990;344:60–62. - PubMed
Publication types
MeSH terms
Grants and funding
LinkOut - more resources
Full Text Sources
