. 2007 Feb 28;27(9):2204-11.
doi: 10.1523/JNEUROSCI.4483-06.2007.

Prefrontal neural correlates of memory for sequences

Affiliations

Prefrontal neural correlates of memory for sequences

Bruno B Averbeck et al. J Neurosci. .

Abstract

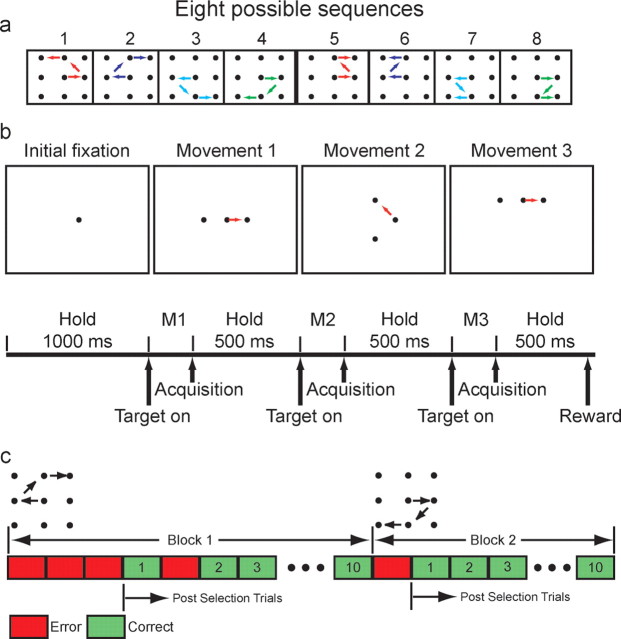
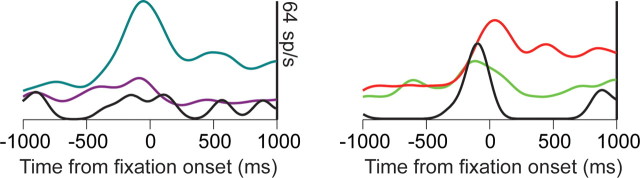
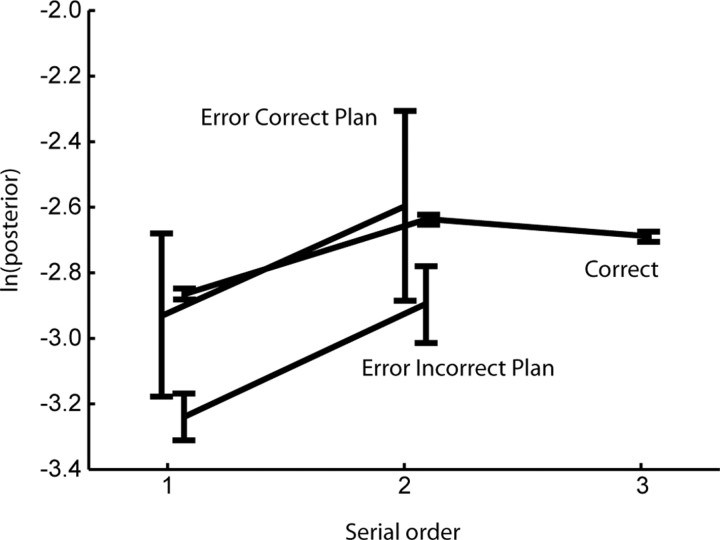
The sequence of actions appropriate to solve a problem often needs to be discovered by trial and error and recalled in the future when faced with the same problem. Here, we show that when monkeys had to discover and then remember a sequence of decisions across trials, ensembles of prefrontal cortex neurons reflected the sequence of decisions the animal would make throughout the interval between trials. This signal could reflect either an explicit memory process or a sequence-planning process that begins far in advance of the actual sequence execution. This finding extended to error trials such that, when the neural activity during the intertrial interval specified the wrong sequence, the animal also attempted to execute an incorrect sequence. More specifically, we used a decoding analysis to predict the sequence the monkey was planning to execute at the end of the fore-period, just before sequence execution. When this analysis was applied to error trials, we were able to predict where in the sequence the error would occur, up to three movements into the future. This suggests that prefrontal neural activity can retain information about sequences between trials, and that regardless of whether information is remembered correctly or incorrectly, the prefrontal activity veridically reflects the animal's action plan.


Figures

Figure 1.
Figure 1.
Task. a, The eight possible sequences the monkeys were trained to execute. Each panel indicates one sequence. b, Temporal sequence of choices in a single trial. The dot in the center of the initial fixation frame indicates the central fixation point. The two dots to the left and right of the central dot in the Movement 1 frame indicate the first two choice targets from which the animal can select. Similarly, the two dots above and below and to the left and right of the fixation in the Movement 2 and Movement 3 frames indicate the possible targets for the saccade at the corresponding points in the sequence. c, Example sequence of trials from two blocks. The data analyzed in this manuscript are the first correct trial and all subsequent trials in each block, indicated as post-selection trials in the figure.
Figure 2.
Figure 2.
Behavioral performance. a, Error rate as a function of the number of correct trials in the block. The vertical axis represents the average number of errors that were committed before getting a trial correct, as a function of the number of correct trials. Trial 0 is all trials before one correct and presumably represents the period where the animal is working out the correct sequence. b, Mean reaction times plotted as a function of the number of correct trials in the block.
Figure 3.
Figure 3.
Spike density functions for three example neurons, showing different activity patterns for different sequences during intertrial interval and fore-period. The intertrial interval is 1 s, and thus −1000 ms approximately corresponds to the end of the previous trial. Time 0 is fixation onset. At 1000 ms, the first pair of targets for the sequence is presented. The gray bar at the bottom of each plot indicates whether there was a significant main effect (p < 0.05) of sequence in a two-way ANOVA (300 ms bins) with sequence and first movement direction as factors.
Figure 4.
Figure 4.
Representation of sequence during intertrial interval and fore-period. a, Percentage of individual neurons that showed a significant effect of sequence during the intertrial interval and the fore-period, expressed as a fraction of those that had a significant effect at the end of the fore-period. The time values indicate the start of the 300 ms bin. Time 0 is the bin beginning at fixation onset, and −1000 is approximately the end of the previous trial. b, Population average of percentage correct classification performance for correct and error trials. The vertical axis is percentage correct classification. c, ln(p) from likelihood ratio test of difference between correct and error curve shown in b. The dashed line indicates ln(0.05).
Figure 5.
Figure 5.
Spike density function examples of sequence misplanning. This is the same neuron as that shown in Figure 3c. The colored lines indicate the average spike density functions for the indicated sequences (same as in Fig. 3c). The black line indicates the spike density function for the individual trial in which the sequence was misplanned. At the left is a case in which the monkey was supposed to execute sequence 8 (blue line), but it was planning sequence 7 (purple line). At the right is a case in which the monkey was supposed to execute sequence 4 (red line), but instead it was planning sequence 2 (green line). In both cases, the single-trial response was more similar to the sequence the monkey was planning than to the sequence the monkey was supposed to execute.
Figure 6.
Figure 6.
Average and SEM of log posterior of neural activity, for the three movements of the sequence, and the three trial types. Correct, Correct trials; Error Correct Plan, error trials with a correct action plan; Error Incorrect Plan, error trials with an incorrect action plan.

Similar articles

Cited by

References

    1. Asaad WF, Rainer G, Miller EK. Neural activity in the primate prefrontal cortex during associative learning. Neuron. 1998;21:1399–1407. - PubMed
    1. Asaad WF, Rainer G, Miller EK. Task-specific neural activity in the primate prefrontal cortex. J Neurophysiol. 2000;84:451–459. - PubMed
    1. Averbeck BB, Lee D. Effects of noise correlations on information encoding and decoding. J Neurophysiol. 2006;95:3633–3644. - PubMed
    1. Averbeck BB, Chafee MV, Crowe DA, Georgopoulos AP. Parallel processing of serial movements in prefrontal cortex. Proc Natl Acad Sci USA. 2002;99:13172–13177. - PMC - PubMed
    1. Averbeck BB, Chafee MV, Crowe DA, Georgopoulos AP. Neural activity in prefrontal cortex during copying geometrical shapes I. Single cells encode shape, sequence, and metric parameters. Exp Brain Res. 2003a;150:127–141. - PubMed

Publication types

LinkOut - more resources