

Dissociation between CA3-CA1 synaptic plasticity and associative learning in TgNTRK3 transgenic mice
- PMID: 17329422
- PMCID: PMC6673497
- DOI: 10.1523/JNEUROSCI.4055-06.2007
Dissociation between CA3-CA1 synaptic plasticity and associative learning in TgNTRK3 transgenic mice
Abstract
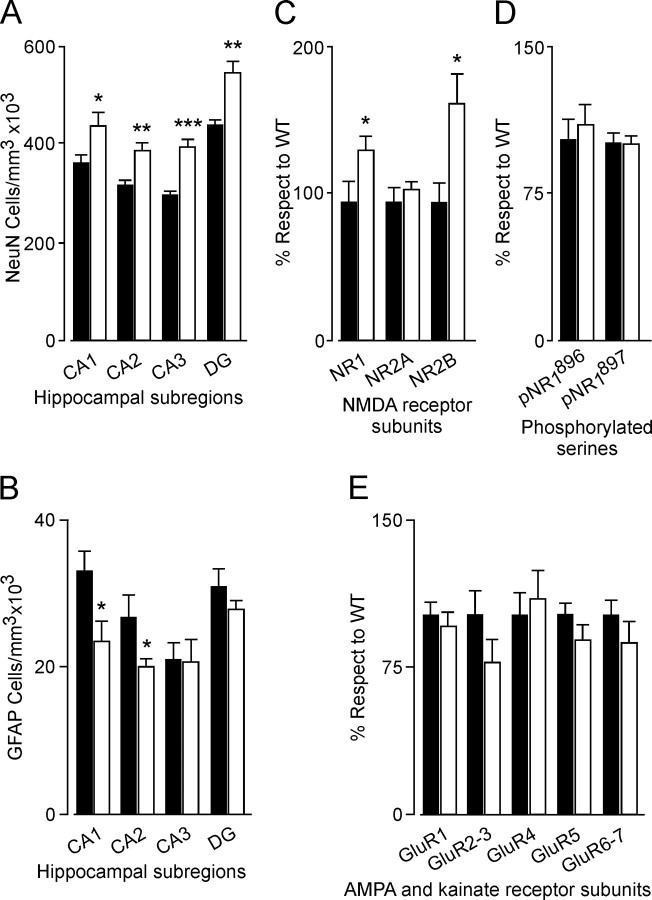
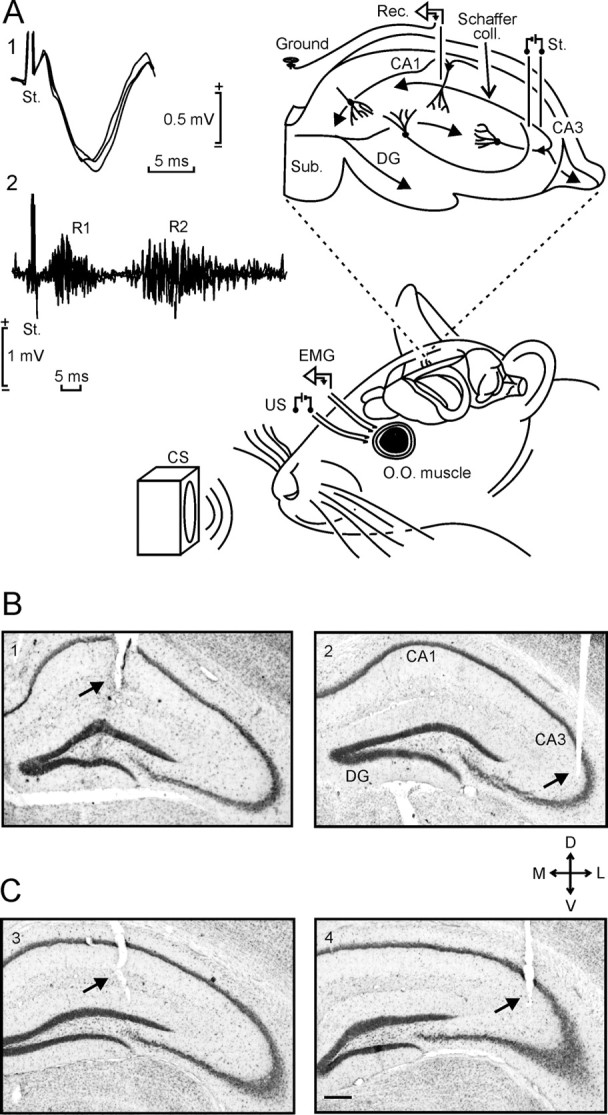
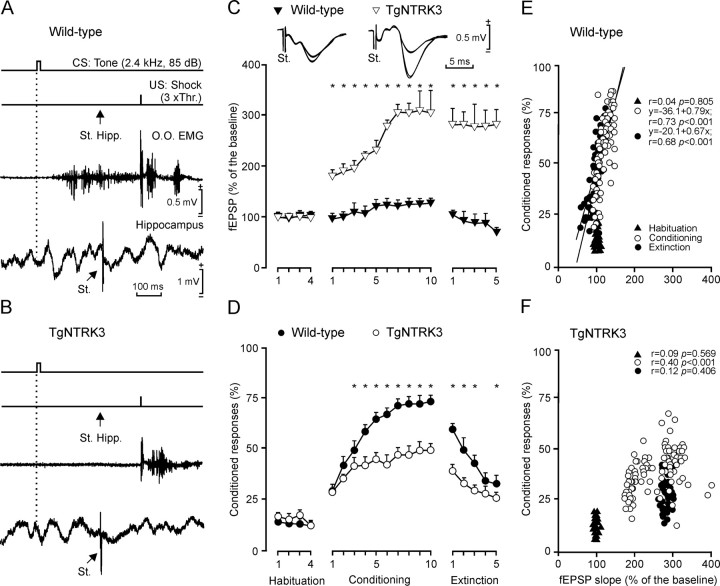
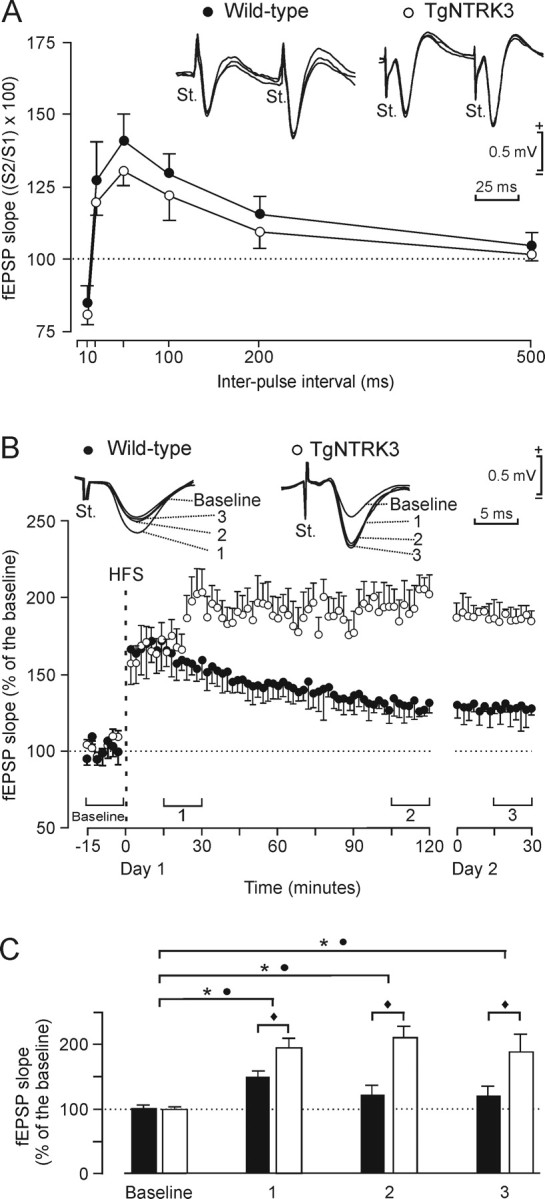
Neurotrophins and their cognate receptors might serve as feedback regulators for the efficacy of synaptic transmission. We analyzed mice overexpressing TrkC (TgNTRK3) for synaptic plasticity and the expression of glutamate receptor subunits. Animals were conditioned using a trace [conditioned stimulus (CS), tone; unconditioned stimulus (US), shock] paradigm. A single electrical pulse presented to the Schaffer collateral-commissural pathway during the CS-US interval evoked a monosynaptic field EPSP (fEPSP) at ipsilateral CA1 pyramidal cells. In wild types, fEPSP slopes increased across conditioning sessions and decreased during extinction, being linearly related to learning evolution. In contrast, fEPSPs in TgNTRK3 animals reached extremely high values, not accompanied with a proportionate increase in their learning curves. Long-term potentiation evoked in conscious TgNTRK3 was also significantly longer lasting than in wild-type mice. These functional alterations were accompanied by significant changes in NR1 and NR2B NMDA receptor subunits, with no modification of NR1(Ser 896) or NR1(Ser 897) phosphorylation. No changes of AMPA and kainate subunits were detected. Results indicate that the NT-3/TrkC cascade could regulate synaptic transmission and plasticity through modulation of glutamatergic transmission at the CA3-CA1 synapse.
Figures
Similar articles
-
Involvement of the CA3-CA1 synapse in the acquisition of associative learning in behaving mice.J Neurosci. 2006 Jan 25;26(4):1077-87. doi: 10.1523/JNEUROSCI.2834-05.2006. J Neurosci. 2006. PMID: 16436593 Free PMC article.
-
Adenosine A(2A) receptor modulation of hippocampal CA3-CA1 synapse plasticity during associative learning in behaving mice.Neuropsychopharmacology. 2009 Jun;34(7):1865-74. doi: 10.1038/npp.2009.8. Epub 2009 Feb 11. Neuropsychopharmacology. 2009. PMID: 19212319
-
Differential effects of long-term potentiation evoked at the CA3 CA1 synapse before, during, and after the acquisition of classical eyeblink conditioning in behaving mice.J Neurosci. 2007 Nov 7;27(45):12139-46. doi: 10.1523/JNEUROSCI.3397-07.2007. J Neurosci. 2007. PMID: 17989280 Free PMC article.
-
Activity-dependent changes of the hippocampal CA3-CA1 synapse during the acquisition of associative learning in conscious mice.Genes Brain Behav. 2007 Jun;6 Suppl 1:24-31. doi: 10.1111/j.1601-183X.2007.00319.x. Genes Brain Behav. 2007. PMID: 17543036 Review.
-
Learning as a Functional State of the Brain: Studies in Wild-Type and Transgenic Animals.Adv Exp Med Biol. 2017;1015:75-93. doi: 10.1007/978-3-319-62817-2_5. Adv Exp Med Biol. 2017. PMID: 29080022 Review.
Cited by
-
The molecular cascades of long-term potentiation underlie memory consolidation of one-trial avoidance in the CA1 region of the dorsal hippocampus, but not in the basolateral amygdala or the neocortex.Neurotox Res. 2008 Oct;14(2-3):273-94. doi: 10.1007/BF03033816. Neurotox Res. 2008. PMID: 19073432 Review.
-
Lentiviral silencing of GSK-3β in adult dentate gyrus impairs contextual fear memory and synaptic plasticity.Front Behav Neurosci. 2015 Jun 23;9:158. doi: 10.3389/fnbeh.2015.00158. eCollection 2015. Front Behav Neurosci. 2015. PMID: 26157370 Free PMC article.
-
Increased opioid dependence in a mouse model of panic disorder.Front Behav Neurosci. 2010 Feb 22;3:60. doi: 10.3389/neuro.08.060.2009. eCollection 2010. Front Behav Neurosci. 2010. PMID: 20204153 Free PMC article.
-
Conditional BDNF Delivery from Astrocytes Rescues Memory Deficits, Spine Density, and Synaptic Properties in the 5xFAD Mouse Model of Alzheimer Disease.J Neurosci. 2019 Mar 27;39(13):2441-2458. doi: 10.1523/JNEUROSCI.2121-18.2019. Epub 2019 Jan 30. J Neurosci. 2019. PMID: 30700530 Free PMC article.
-
Interferon-β Inhibits Neurotrophin 3 Signalling and Pro-Survival Activity by Upregulating the Expression of Truncated TrkC-T1 Receptor.Mol Neurobiol. 2017 Apr;54(3):1825-1843. doi: 10.1007/s12035-016-9789-2. Epub 2016 Feb 18. Mol Neurobiol. 2017. PMID: 26887385
References
-
- Agassandian K, Gedney M, Cassell MD. Neurotrophic factors in the central nucleus of amygdala may be organized to provide substrates for associative learning. Brain Res. 2006;1076:78–86. - PubMed
-
- Barbacid M. The Trk family of neurotrophin receptors. J Neurobiol. 1994;25:1386–1403. - PubMed
-
- Blum R, Konnerth A. Neurotrophin-mediated rapid signaling in the central nervous system: mechanisms and functions. Physiology (Bethesda) 2005;20:70–78. - PubMed
-
- Bonhoeffer T. Neurotrophins and activity-dependent development of the neocortex. Curr Opin Neurobiol. 1996;6:119–126. - PubMed
Publication types
MeSH terms
Substances
LinkOut - more resources
Full Text Sources
Molecular Biology Databases
Research Materials
Miscellaneous