. 2007 Feb 28;27(9):2261-71.
doi: 10.1523/JNEUROSCI.5582-06.2007.

Parvalbumin is a mobile presynaptic Ca2+ buffer in the calyx of Held that accelerates the decay of Ca2+ and short-term facilitation

Affiliations

Parvalbumin is a mobile presynaptic Ca2+ buffer in the calyx of Held that accelerates the decay of Ca2+ and short-term facilitation

Martin Müller et al. J Neurosci. .

Abstract

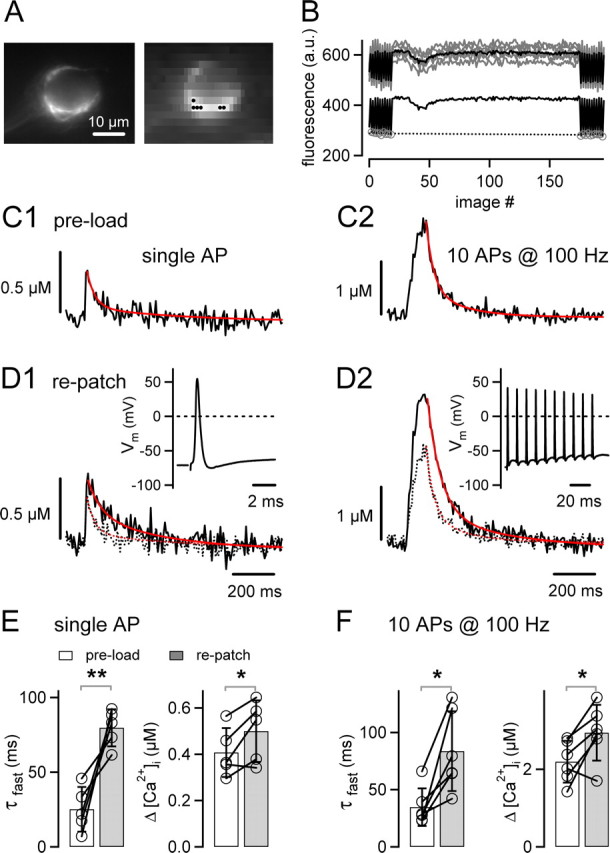
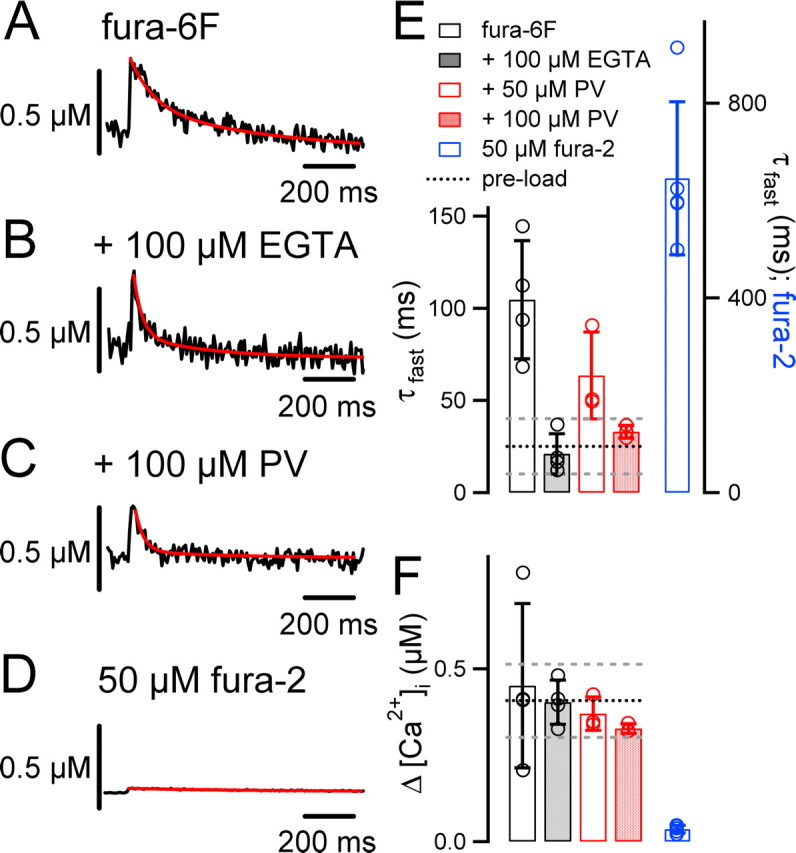
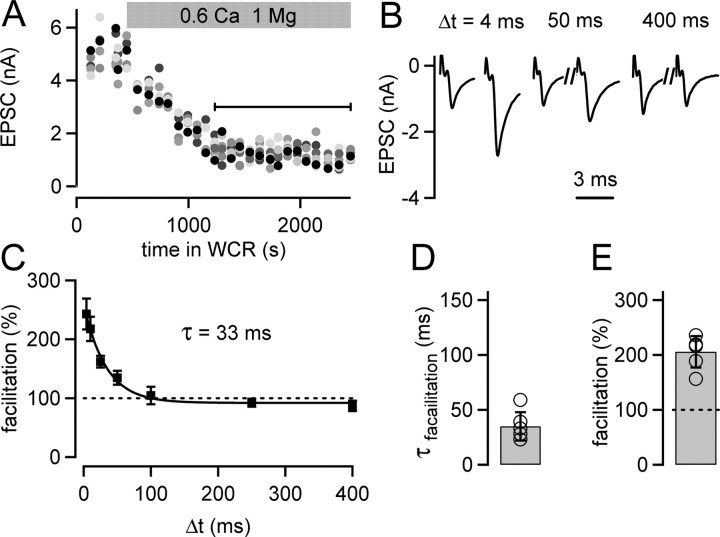
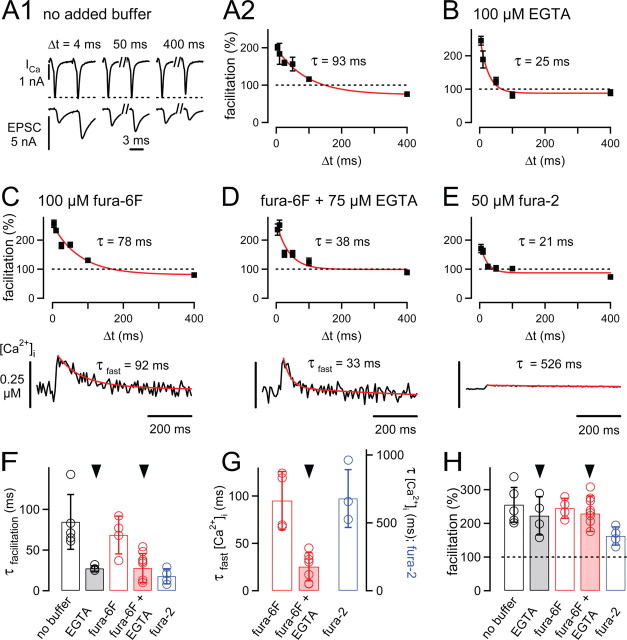
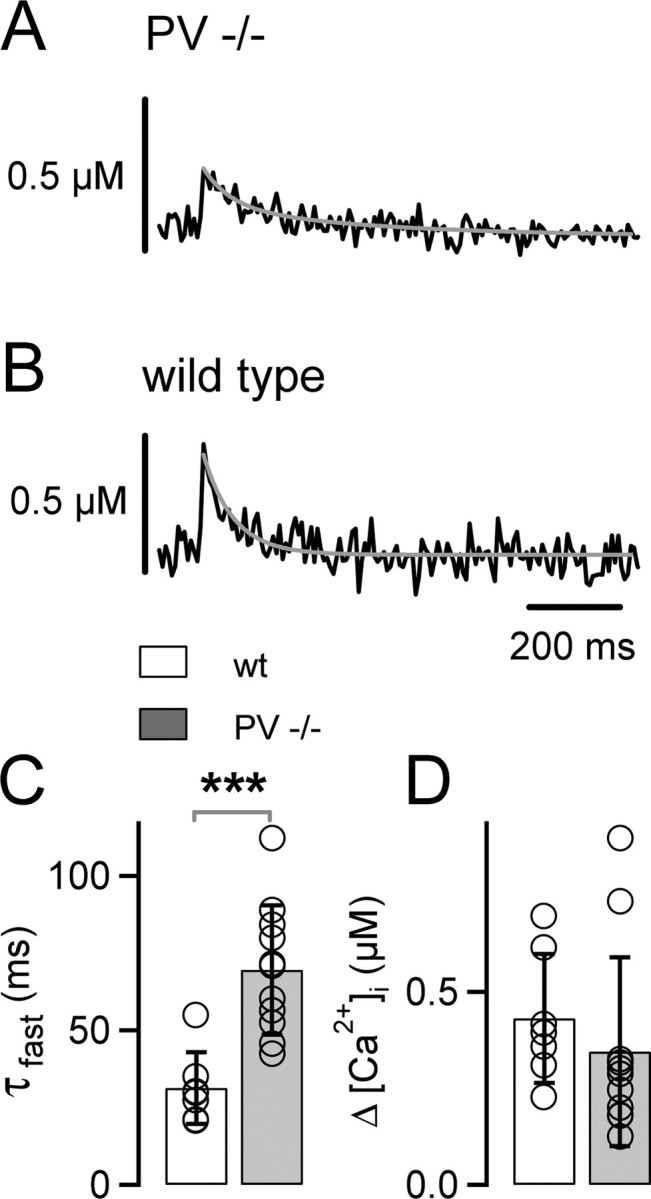
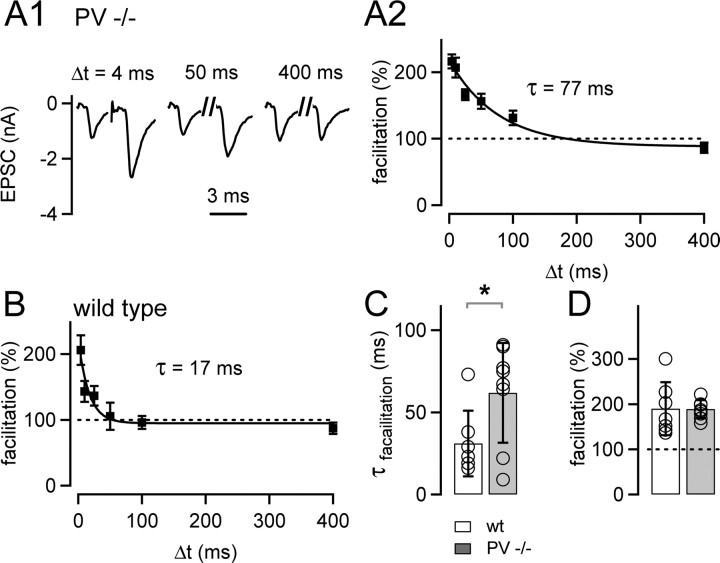
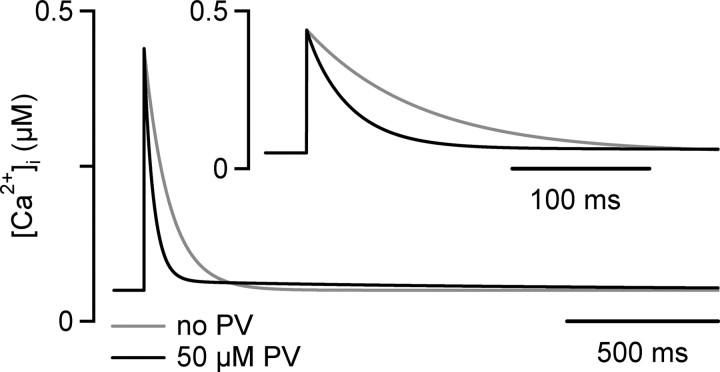
Presynaptic Ca2+ signaling plays a crucial role in short-term plasticity of synaptic transmission. Here, we studied the role of mobile endogenous presynaptic Ca2+ buffer(s) in modulating paired-pulse facilitation at a large excitatory nerve terminal in the auditory brainstem, the calyx of Held. To do so, we assessed the effect of presynaptic whole-cell recording, which should lead to the diffusional loss of endogenous mobile Ca2+ buffers, on paired-pulse facilitation and on intracellular Ca2+ concentration ([Ca2+]i) transients evoked by action potentials. In unperturbed calyces briefly preloaded with the Ca2+ indicator fura-6F, the [Ca2+]i transient decayed surprisingly fast (tau(fast), approximately 30 ms). Presynaptic whole-cell recordings made without additional Ca2+ buffers slowed the decay kinetics of [Ca2+]i and paired-pulse facilitation (twofold to threefold), but the amplitude of the [Ca2+]i transient was changed only marginally. The fast [Ca2+]i decay was restored by adding the slow Ca2+ buffer EGTA (50-100 microM) or parvalbumin (100 microM), a Ca2+-binding protein with slow Ca2+-binding kinetics, to the presynaptic pipette solution. In contrast, the fast Ca2+ buffer fura-2 strongly reduced the amplitude of the [Ca2+]i transient and slowed its decay, suggesting that the mobile endogenous buffer in calyces of Held has slow, rather than fast, binding kinetics. In parvalbumin knock-out mice, the decay of [Ca2+]i and facilitation was slowed approximately twofold compared with wild-type mice, similar to what is observed during whole-cell recordings in rat calyces of Held. Thus, in young calyces of Held, a mobile Ca2+ buffer with slow binding kinetics, primarily represented by parvalbumin, accelerates the decay of spatially averaged [Ca2+]i and paired-pulse facilitation.


Figures

Figure 1.
Figure 1.
Rapid decay of AP-induced [Ca2+]i transients in unperturbed calyces of Held. A, Fluorescence image showing a calyx of Held that was preloaded with 80–100 μm fura-6F during a brief (∼30 s) whole-cell recording (left image taken at 1 × 1 pixel binning; right image taken at 8 × 15 binning). Scale bar, 10 μm. B, Fluorescence signals (top gray traces) of the six superpixels marked in A (black dots in right image) and the resulting average fluorescence signal (superimposed black trace) during a single 100 Hz train of 10 stimuli. The bottom black trace represents the background-corrected average fluorescence signal. The F355 values (gray circles) measured before and after the stimulation were linearly interpolated (black dotted line) and used to calculate the fluorescence ratio (see Materials and Methods). C, Average [Ca2+]i transients elicited by single APs (average of n = 32 traces; C1) or by 10 APs at 100 Hz (average of n = 4; C2) in a calyx preloaded with fura-6F. The decays of both [Ca2+]i transients were fitted with double exponentials (red traces). D, Average [Ca2+]i transients evoked by single APs (D1) and by 10 APs at 100 Hz (D2), as assessed during a continuous whole-cell recording with 100 μm fura-6F of the same terminal as shown in A–C. For comparison, the corresponding [Ca2+]i transients obtained after preloading (C) are shown as dotted traces. The insets depict presynaptic APs measured in response to single stimuli and 100 Hz trains. Data in A–D are from the same cell. E, Fast decay time constants (τfast; left) and mean amplitudes (right) of single AP-evoked [Ca2+]i transients recorded in n = 5 rat calyces after preloading (open bar) and after repatching (gray bar). Note the significant slowing after repatching (p = 0.009). F, Fast decay time constants (τfast; left) and amplitudes ([Ca2+]i; right) of [Ca2+]i transients in response to the 100 Hz trains.
Figure 2.
Figure 2.
The slow Ca2+ buffers EGTA and parvalbumin restore the fast decay of AP-evoked [Ca2+]i transients. A, AP-evoked [Ca2+]i transient (average of n = 21 sweeps) during presynaptic whole-cell recording of a calyx of Held with 100 μm fura-6F in the pipette solution. B, A [Ca2+]i transient (average of n = 32) from another calyx, recorded with 100 μm fura-6F and 100 μm EGTA in the pipette solution. C, Example of a [Ca2+]i transient (average of n = 18) measured in a rat calyx with 100 μm fura-6F and 100 μm parvalbumin added to the presynaptic pipette solution. Note that the [Ca2+]i transients decay more rapidly in the presence of EGTA (B) and parvalbumin (C) compared with the no-added buffer condition (A). D, Example of a [Ca2+]i transient (average of n = 10 sweeps) recorded with 50 μm fura-2. Note the small amplitude and the slow decay of [Ca2+]i. In A–D, red lines are double-exponential (A–C) or single-exponential (D) fits of the [Ca2+]i decay. E, Average fast decay time constants (τfast) of AP-evoked [Ca2+]i transients of calyces of Held recorded with 100 μm fura-6F (open bars; n = 4 cells), 100 μm fura-6F and 100 μm EGTA (gray bars; n = 4 cells), 100 μm fura-6F and 50 μm parvalbumin (open red bar; n = 3 cells), 100 μm fura-6F and 100 μm parvalbumin (filled red bar; n = 4), or 50 μm fura-2 (blue bar; n = 5). The fura-2 data, which have an order of magnitude slower [Ca2+]i decay, are plotted on the right y-axis. Note that 100 μm parvalbumin restored the rapid [Ca2+]i decay observed in unperturbed calyces of Held (Fig. 1E) (p = 0.4). F, Mean [Ca2+]i amplitudes measured under the various Ca2+ buffer conditions. The black and gray dotted lines in E and F represent the average ± SD of the corresponding values obtained in measurements of unperturbed calyces of Held (Fig. 1E).
Figure 3.
Figure 3.
Paired-pulse facilitation under conditions of afferent fiber stimulation decays surprisingly fast at the calyx of Held. A, EPSC amplitudes in response to the first stimulus of pairs of afferent fiber stimuli, plotted as a function of time in whole-cell recording (WCR). Paired pulses were applied at various intervals. The first EPSC amplitude for each interstimulus interval is shown, and the grayscale code identifies the length of the interstimulus interval (black symbol, 4 ms; longer intervals are represented by increasingly lighter gray tones). At the time indicated by the gray bar, the extracellular [Ca2+] was changed from 2 to 0.6 mm. The analysis of paired-pulse facilitation was restricted to the phase of the experiment during which the effect of the low extracellular [Ca2+] had stabilized (black line). B, Average EPSCs (n = 15 sweeps) in response to pulse pairs given at three different interstimulus intervals (Δt) that were recorded during the period specified by the black line in A. C, Paired-pulse facilitation (facilitation = average EPSC2/average EPSC1 × 100) as a function of Δt of the cell shown in A and B. The average data points (n = 15 repetitions) were fitted by an exponential function yielding a time constant (τ) of 33 ms. D, Mean decay time constants of facilitation of n = 6 individual cells (open circles). E, The average maximal facilitation (n = 6 cells) measured at the shortest interstimulus interval of 4 ms.
Figure 4.
Figure 4.
The influence of presynaptically added Ca2+ buffers on paired-pulse facilitation and presynaptic [Ca2+]i transients. A1, Examples of presynaptic whole-cell calcium currents (ICa) and EPSCs in response to paired voltage-clamp pulses of three different interstimulus intervals (Δt). A2, Paired-pulse facilitation (mean ± SEM) of the recording shown in A1. The data were fitted with an exponential function, with time constant τ = 93 ms. B, Paired-pulse facilitation in another cell pair, in which 100 μm EGTA was added to the presynaptic intracellular solution. Note the accelerated decay of facilitation. C, Mean facilitation (top) and presynaptic [Ca2+]i (bottom) measured with 100 μm fura-6F added to the presynaptic pipette solution. D, Facilitation and presynaptic [Ca2+]i transient in a cell pair recorded with 100 μm fura-6F and 75 μm EGTA in the presynaptic pipette solution. E, Facilitation and presynaptic [Ca2+]i of a cell pair recorded with 50 μm fura-2 in the presynaptic pipette solution. In A2–E, red lines are single- or double-exponential fits, with the time constants (τ) or fast time constants in the case of double-exponential fits (τfast) as indicated. F, Average decay time constants of facilitation recorded under the various conditions of presynaptically added Ca2+ buffer. Note the significant speeding of the decay of facilitation to ∼30 ms induced by 100 μm EGTA (p = 0.029) or by 75 μm EGTA and 100 μm fura-6F (p = 0.005). G, Average fast decay time constants of [Ca2+]i transients recorded with 100 μm fura-6F without added buffer (red open bar; n = 4 cells) and with 75 μm EGTA (n = 9; red bar). The blue bar (right ordinate) shows the average decay time constant of [Ca2+]i (monoexponential fit) measured with 50 μm fura-2 (n = 3). EGTA (75 μm) significantly (p = 0.0005) accelerated the decay of [Ca2+]i compared with the no-added buffer condition (arrowhead). H, Amplitude of facilitation under the different conditions of presynaptically added Ca2+ buffers. Note the significant decrease in facilitation in the presynaptic presence of 50 μm fura-2 (blue bar).
Figure 5.
Figure 5.
AP-induced presynaptic [Ca2+]i transients decay slowly in parvalbumin knock-out mice. A, B, Example of [Ca2+]i transients in a calyx of Held from a PV−/− mouse (A) and from a wild-type (wt) mouse (B). The decay of the [Ca2+]i transients were fitted with double-exponential functions (gray traces). C, D, Average fast decay time constants (τfast; C) and average amplitudes ([Ca2+]i; D) of [Ca2+]i transients elicited by single APs in PV−/− (gray bars; n = 11 cells) and in wild-type (white bars; n = 7 cells) cells. Note the significant slowing (p = 0.0005) of the [Ca2+]i transients in PV−/− mice, whereas the [Ca2+]i amplitudes were not significantly different (p = 0.42).
Figure 6.
Figure 6.
Paired-pulse facilitation decays slowly at the calyx of Held of parvalbumin knock-out mice. A1, Representative EPSCs in response to pulse pairs at three different interstimulus intervals (Δt) in a PV−/− cell, recorded at 0.6 mm extracellular [Ca2+]. A2, Mean facilitation as a function of the interstimulus interval of the PV−/− cell shown in A1 (n = 15 repetitions). The data were fitted by an exponential function, with a time constant of 77 ms. B, Paired-pulse facilitation in a cell from a wild-type (wt) mouse (n = 17 repetitions). Note the fast decay of paired-pulse facilitation, with a time constant of 17 ms in this cell. C, Average decay time constants of paired-pulse facilitation obtained in n = 8 cells from PV−/− mice (gray bar), and in n = 7 cells from wild-type mice (white bar). Note the significantly (p = 0.039) slower decay of paired-pulse facilitation in PV−/− mice. D, The amplitude of paired-pulse facilitation was unchanged between wild-type mice (open bar; n = 7 cells) and PV−/− mice (gray bar; n = 8 cells; p = 0.96).
Figure 7.
Figure 7.
A modified single-compartment model of Ca2+ signaling at the calyx of Held. An AP-evoked, spatially averaged [Ca2+]i transient was simulated either in the absence of a slow Ca2+ buffer (gray trace) or in the presence of 50 μm parvalbumin (PV). See Materials and Methods for the parameters used in the simulation. The inset shows the simulated [Ca2+]i traces at increased time resolution. The simulated [Ca2+]i transient in the absence of parvalbumin (gray traces) was well fitted by a single-exponential function, with time constant τ = 78 ms. In the presence of 50 μm parvalbumin, the initial decay of [Ca2+]i was accelerated, and the decay of [Ca2+]i was now best fit by a double-exponential function, with fast and slow time constants of 31 and 1310 ms, respectively. Note that the combination of a low endogenous Ca2+ buffer capacity (κs = 40), a fast Ca2+ extrusion rate (γ = 500 s−1), and the presence of a Ca2+ buffer with slow binding kinetics result in an extremely fast initial decay of spatially averaged [Ca2+]i.

Similar articles

Cited by

References

    1. Airaksinen MS, Eilers J, Garaschuk O, Thoenen H, Konnerth A, Meyer M. Ataxia and altered dendritic calcium signaling in mice carrying a targeted null mutation of the calbindin D28k gene. Proc Natl Acad Sci USA. 1997;94:1488–1493. - PMC - PubMed
    1. Atluri PP, Regehr WG. Determinants of the time course of facilitation at the granule cell to Purkinje cell synapse. J Neurosci. 1996;16:5661–5671. - PMC - PubMed
    1. Blatow M, Caputi A, Burnashev N, Monyer H, Rozov A. Ca2+ buffer saturation underlies paired pulse facilitation in calbindin-D28k-containing terminals. Neuron. 2003;38:79–88. - PubMed
    1. Borst JG, Helmchen F, Sakmann B. Pre- and postsynaptic whole-cell recordings in the medial nucleus of the trapezoid body of the rat. J Physiol (Lond) 1995;489:825–840. - PMC - PubMed
    1. Borst JGG, Sakmann B. Calcium influx and transmitter release in a fast CNS synapse. Nature. 1996;383:431–434. - PubMed

Publication types

LinkOut - more resources