. 2007 May;45(5):1572-80.
doi: 10.1128/JCM.02090-06. Epub 2007 Feb 28.

Population-based sequencing of the V3 region of env for predicting the coreceptor usage of human immunodeficiency virus type 1 quasispecies

Affiliations

Population-based sequencing of the V3 region of env for predicting the coreceptor usage of human immunodeficiency virus type 1 quasispecies

Pierre Delobel et al. J Clin Microbiol. 2007 May.

Abstract

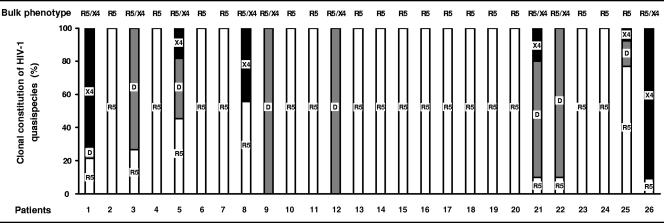
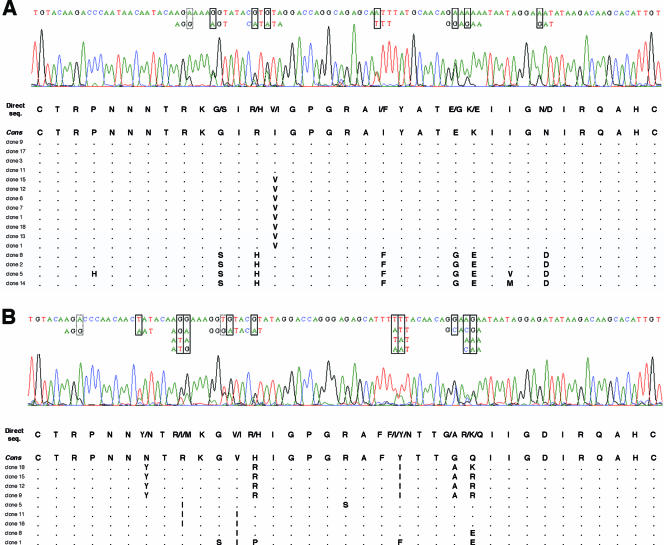
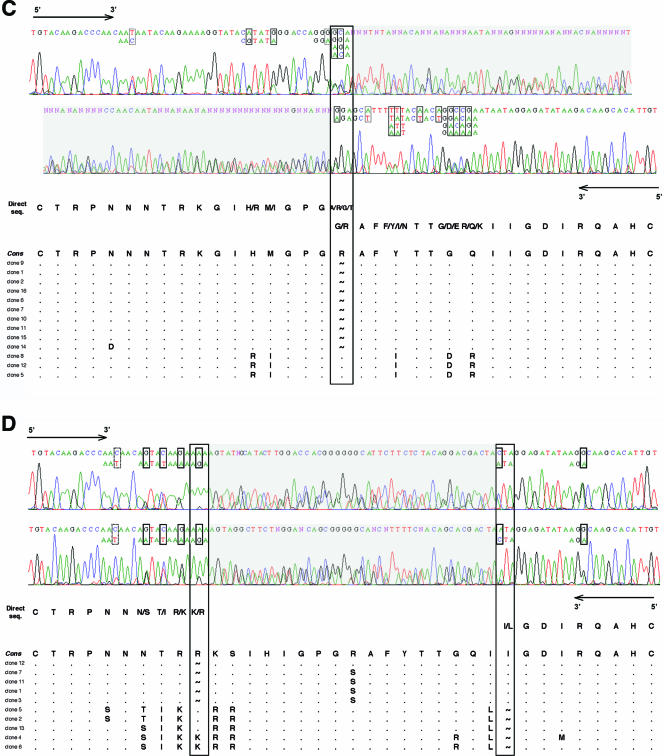
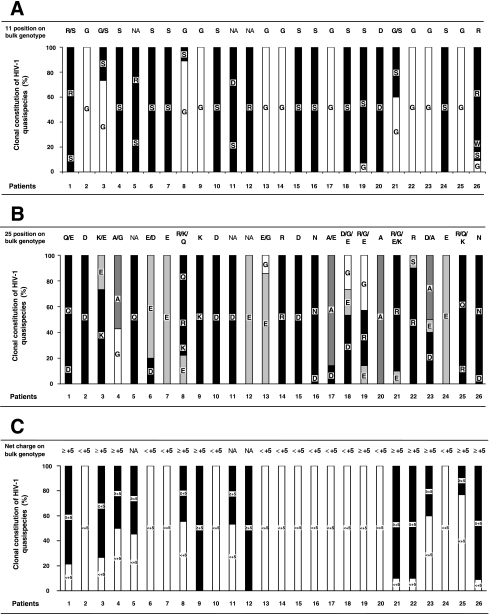
Genotypic population-based methods could be faster and less expensive than phenotypic recombinant assays for determining human immunodeficiency virus type 1 (HIV-1) coreceptor usage in patient samples, but their clinical use requires good genotype-phenotype correlation and concordance with clonal analyses. We have assessed these requirements by clonal analysis of the V1 to V3 env PCR products of 26 patients infected with subtype B HIV-1. We used the resulting set of molecular clones, all sequenced and characterized using a single-cycle recombinant virus phenotypic entry assay, to reevaluate genotype-phenotype correlations. Combining the previously described 11/25 and net charge rules for the V3 genotype improved the prediction of HIV-1 coreceptor usage. We also evaluated the concordance of population-based and clonal analyses for predicting the coreceptor usage of HIV-1 quasispecies. Our population-based recombinant phenotypic assay and direct sequencing of V3 were similarly sensitive for detecting the presence of minor species in the virus population, and both correlated well with clonal analysis. The improved genotype-phenotype correlation obtained by combining two simple genotypic rules and the good concordance with clonal analyses suggest that direct sequencing of V3 is a valuable alternative to population-based recombinant phenotypic assays.


Figures

FIG. 1.
FIG. 1.
Phenotypic characterization of HIV-1 coreceptor usage by bulk and clonal analyses of virus quasispecies. The bulk phenotype obtained with our recombinant virus phenotypic entry assay of uncloned env PCR products for the 26 patients is indicated at the top of the figure. The results obtained by bulk and clonal analyses were compared using the proportions of R5 (white), R5X4 dualtropic D (gray), and X4 (black) molecular clones making up the quasispecies for each patient. Genetically unique (n = 218) and redundant (n = 102) molecular clones are included in the descriptions of the quasispecies since all contributed to the bulk signal obtained when the phenotype of the entire virus population was tested.
FIG. 2.
FIG. 2.
Electrophoregrams of V3 obtained by direct sequencing: concordance with clonal genotypic analysis. Minor species were detected when the automated sequencer electrophoregram showed a second base peak. Various nucleotides are boxed (solid, nonsynonymous changes; dashed, synonymous changes), and all possible combinations are shown when contiguous nucleotide polymorphisms are present in a given codon. The V3 genotype is shown with all possible amino acids deduced from direct sequencing (seq.) and compared to aligned amino acid sequences obtained by clonal analysis. Genetically unique (n = 218) and redundant (n = 102) molecular clones have been included in the description of the quasispecies since all contributed to the bulk sequence obtained when the entire virus population was sequenced. (A and B) Successful genotyping of V3 by direct sequencing. Examples of patient 3 and 8 virus populations. Automated sequencer electrophoregrams obtained from bulk PCR products of patient 3 (A) and patient 8 (B) virus populations. The PCR products were sequenced in both directions, but only the 5′-to-3′ strand is shown. (C and D) Difficulties in genotyping of V3 because of length polymorphisms. Examples of patient 25 and 5 virus populations. Automated sequencer electrophoregrams for bulk PCR products of patient 25 (C) and patient 5 (D) virus populations. Both the forward 5′-to-3′ and reverse 3′-to-5′ strands are shown. The single (C) and multiple (D) insertion/deletion sites responsible for a downstream frameshift in certain virus clones are boxed. A tilde represents a gap inserted in the amino acid sequence of a clone to maintain the alignment. Electrophoregrams that could not be analyzed because of overlapping peaks are shaded gray. The V3 genotype of the patient 25 virus population was determined from the start to the insertion/deletion site in the sense direction and from the end back to the insertion/deletion site in the antisense direction (C). Insertion/deletion sites at two different positions within V3 prevented the determination of the full genotype of the patient 5 virus population (D). Cons, consensus sequence.
FIG. 2.
FIG. 2.
Electrophoregrams of V3 obtained by direct sequencing: concordance with clonal genotypic analysis. Minor species were detected when the automated sequencer electrophoregram showed a second base peak. Various nucleotides are boxed (solid, nonsynonymous changes; dashed, synonymous changes), and all possible combinations are shown when contiguous nucleotide polymorphisms are present in a given codon. The V3 genotype is shown with all possible amino acids deduced from direct sequencing (seq.) and compared to aligned amino acid sequences obtained by clonal analysis. Genetically unique (n = 218) and redundant (n = 102) molecular clones have been included in the description of the quasispecies since all contributed to the bulk sequence obtained when the entire virus population was sequenced. (A and B) Successful genotyping of V3 by direct sequencing. Examples of patient 3 and 8 virus populations. Automated sequencer electrophoregrams obtained from bulk PCR products of patient 3 (A) and patient 8 (B) virus populations. The PCR products were sequenced in both directions, but only the 5′-to-3′ strand is shown. (C and D) Difficulties in genotyping of V3 because of length polymorphisms. Examples of patient 25 and 5 virus populations. Automated sequencer electrophoregrams for bulk PCR products of patient 25 (C) and patient 5 (D) virus populations. Both the forward 5′-to-3′ and reverse 3′-to-5′ strands are shown. The single (C) and multiple (D) insertion/deletion sites responsible for a downstream frameshift in certain virus clones are boxed. A tilde represents a gap inserted in the amino acid sequence of a clone to maintain the alignment. Electrophoregrams that could not be analyzed because of overlapping peaks are shaded gray. The V3 genotype of the patient 25 virus population was determined from the start to the insertion/deletion site in the sense direction and from the end back to the insertion/deletion site in the antisense direction (C). Insertion/deletion sites at two different positions within V3 prevented the determination of the full genotype of the patient 5 virus population (D). Cons, consensus sequence.
FIG. 3.
FIG. 3.
Genotypic characterization of V3 positions 11 and 25 and net charge by bulk and clonal analyses of virus quasispecies. The bulk genotype obtained by direct sequencing of uncloned env PCR products for the 26 patients is indicated at the top of the figure. NA (not analyzable) is indicated if the bulk genotype could not be determined by direct sequencing. The results obtained by bulk and clonal analyses were compared using the proportions of molecular clones making up the quasispecies for each patient. Genetically unique (n = 218) and redundant (n = 102) molecular clones are included in the description of the quasispecies since all contributed to the bulk sequence obtained when the entire virus population was sequenced. (A) Bulk and clonal genotypic analyses of V3 position 11. (B) Bulk and clonal genotypic analyses of V3 position 25. (C) Bulk and clonal genotypic analyses of the V3 net charge.

References

    1. Albert, J., P. Stalhandske, S. Marquina, J. Karis, R. A. Fouchier, E. Norrby, and F. Chiodi. 1996. Biological phenotype of HIV type 2 isolates correlates with V3 genotype. AIDS Res. Hum. Retrovir. 12:821-828. - PubMed
    1. Alkhatib, G., C. Combadiere, C. C. Broder, Y. Feng, P. E. Kennedy, P. M. Murphy, and E. A. Berger. 1996. CC CKR5: a RANTES, MIP-1alpha, MIP-1beta receptor as a fusion cofactor for macrophage-tropic HIV-1. Science 272:1955-1958. - PubMed
    1. Berger, E. A., R. W. Doms, E. M. Fenyo, B. T. Korber, D. R. Littman, J. P. Moore, Q. J. Sattentau, H. Schuitemaker, J. Sodroski, and R. A. Weiss. 1998. A new classification for HIV-1. Nature 391:240. - PubMed
    1. Berger, E. A., P. M. Murphy, and J. M. Farber. 1999. Chemokine receptors as HIV-1 coreceptors: roles in viral entry, tropism, and disease. Annu. Rev. Immunol. 17:657-700. - PubMed
    1. Briggs, D. R., D. L. Tuttle, J. W. Sleasman, and M. M. Goodenow. 2000. Envelope V3 amino acid sequence predicts HIV-1 phenotype (co-receptor usage and tropism for macrophages). AIDS 14:2937-2939. - PubMed

Publication types