. 2007 Feb 28;2(2):e251.
doi: 10.1371/journal.pone.0000251.

On the origin of the functional architecture of the cortex

Affiliations

On the origin of the functional architecture of the cortex

Dario L Ringach. PLoS One. .

Abstract

The basic structure of receptive fields and functional maps in primary visual cortex is established without exposure to normal sensory experience and before the onset of the critical period. How the brain wires these circuits in the early stages of development remains unknown. Possible explanations include activity-dependent mechanisms driven by spontaneous activity in the retina and thalamus, and molecular guidance orchestrating thalamo-cortical connections on a fine spatial scale. Here I propose an alternative hypothesis: the blueprint for receptive fields, feature maps, and their inter-relationships may reside in the layout of the retinal ganglion cell mosaics along with a simple statistical connectivity scheme dictating the wiring between thalamus and cortex. The model is shown to account for a number of experimental findings, including the relationship between retinotopy, orientation maps, spatial frequency maps and cytochrome oxidase patches. The theory's simplicity, explanatory and predictive power makes it a serious candidate for the origin of the functional architecture of primary visual cortex.


Conflict of interest statement

Competing Interests: The author has declared that no competing interests exist.

Figures

Figure 1
Figure 1
Spatial statistics of X retinal ganglion cell mosaic. (a) The result of simulating the layout of the RGC mosaic of ON-center (red) and OFF-center (blue) ganglion cells using the method of Eglen et al (2005). The simulation captures the property that ON/OFF cell pairs lying in close proximity of one another. (b) Conditional density of ON-center cells given that one ON-center cell is located at the center of the image. The shape of the conditional density illustrates that there is a disk of low density surrounding the cell, followed by a rim of high density and then decaying back to the average level. This is the behavior expected from a quasiregular distribution of cell bodies. (b) The conditional density of OFF-center cells given that one ON-center cell is located at the center of the image. The density is flat except for the fact that it dips at the center, indicating that cells bodies cannot overlap.
Figure 2
Figure 2
Orientation maps and simple cell receptive fields generated by the model. The orientation map and representative receptive fields at three locations on the map are shown. Receptive fields are represented in a pseudo-color map such that ON-subregions appear in red and OFF-subregions appear in blue. The horizontal scale bar represents 1mm of cortex.
Figure 3
Figure 3
Retinotopy is linked to the local density of retinal ganglion cells. (a) Local distortions in the retinotopy are linked to the local RGC density. The diagram illustrates the location of the RGCs in one patch retina along with the locations in visual space of the centers of cortical RFs whose cell bodies lie on a perfectly square grid on the cortex. All regions bounded by adjacent vertical and horizontal contours map to the same square on the cortical grid. Thus, large regions correspond to locations of low magnification factors and small regions correspond to locations of high magnification factors. (b) The distribution of the Jacobian is such that it sprinkled with discrete regions of local maxima. These regions of rapid change in the cortical RF locations correspond to areas of low densities in the RGC mosaics (both ON and OFF cells are shown by the white dots). (c) The figure shows a scatter-plot of (ρON, ρOFF) while indicating in red those locations with the highest 10% (in red) and the lowest 10% (in blue) values of the Jacobian.
Figure 4
Figure 4
Regions of rapid retinotopic change tend to align with regions of rapid orientation change. (a) A example of an orientation map along with contours bounding the locations with the top 10% values of the Jacobian. There appears to be a tendency for these regions to fall near pinwheels or fractures. (b) Distribution of the orientation structure index (where linear zones attain a value of one, and pinwheels/fractures a value near zero), for regions with high and low Jacobian values.
Figure 5
Figure 5
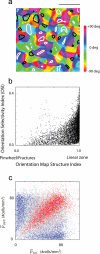
Dependence of orientation selectivity as a function of location in orientation map and retinal ganglion cell density. (a) Example of an orientation map generated by the model along with regions of high (white contours) and low (dark contours) selectivity. It is apparent that there is a tendency for the white contours to lie in linear regions, while dark contours tend ot lie close to pinwheels or fractures. (b) Scatter-plot between the map structure index and the orientation selectivity index across a simulated piece of cortex. Regions in the map with rapid orientation change tend to have low orientation selectivity. (c) Dependence of orientation selectivity as a function of the local density of ON-center and OFF-center cells. Well tuned cells lie in regions where the densities are both high, as these are regions that will tend to generate RF with two or more subregions. Locations where only one class of cell dominates will tend to generate RFs with one dominant subregion and be broadly tuned for orientation.
Figure 6
Figure 6
Spatial frequency maps and their relation to selectivity for orientation. (a) Spatial frequency map with regions of high (white contours) and low (dark contours) orientation selectivity superimposed. Regions that are well tuned for orientation tend to have higher spatial frequency preference. (b) Scatter-plot showing a positive correlation of orientation selectivity and spatial frequency preference. (c) Dependence of spatial frequency preference as a function of the local density of ON-center and OFF-center cells.
Figure 7
Figure 7
Relationship between orientation and spatial frequency map. (a) Example of an orientation map along with areas of high (white contours) and low (dark contours) spatial frequency selectivity. There appears to be a tendency for both high and low spatial frequency domains to align with pinwheels. (b). Plotting the absolute deviation of the local spatial frequency from the mean across the population as a function the local map structure confirms that regions with low map structure indices, corresponding to pinwheels/fractures, tend to be associated with an extreme (either low/high) spatial frequency location (the opposite is not always true).
Figure 8
Figure 8
Cytochrome oxidase blobs. (a) The distribution of a metabolic activity index from the RFs generated by the model shows a clustering of cells with broad selectivity generating a blob-like pattern. (b) Regions of high metabolic activity (putative location of the CO blobs), as expected, tend to align with regions of low spatial frequency preference. (c) An example of an orientation map along with regions of high (white contours) and low (dark contours) metabolic activity. There appears to be no obvious relationship between the two. (d) A closer examination by plotting the metabolic activity index versus the orientation map structure index shows that regions of rapid orientation change (pinwheels/fractures) tend to align with regions of low metabolic activity, consistent with the experimental finding of Shoham et al (1997).
Figure 9
Figure 9
Relative RGC density as the seed for ocular dominance columns. (a) The relative density of left/right eyes at a scale relevant for the formation of receptive fields shows large fluctuations, in the order of 60%, which could seed the formation of ocular dominance columns despite an early contralateral dominance. (b) When anisotropy in the retinotopy map is simulated, the result is a relative density having a banding pattern similar to that observed in some primates.

Similar articles

Cited by

References

    1. Hubel DH, Wiesel TN. Receptive Fields of Single Neurones in the Cats Striate Cortex. Journal of Physiology-London. 1959;148:574–591. - PMC - PubMed
    1. Hubel DH, Wiesel TN. Receptive Fields, Binocular Interaction and Functional Architecture in Cats Visual Cortex. Journal of Physiology-London. 1962;160:106–&. - PMC - PubMed
    1. Mountcastle VB. Modality and Topographic Properties of Single Neurons of Cats Somatic Sensory Cortex. Journal of Neurophysiology. 1957;20:408–434. - PubMed
    1. Mountcastle VB. The columnar organization of the neocortex. Brain. 1997;120:701–722. - PubMed
    1. Grinvald A, Lieke E, Frostig RD, Gilbert CD, Wiesel TN. Functional Architecture of Cortex Revealed by Optical Imaging of Intrinsic Signals. Nature. 1986;324:361–364. - PubMed

Publication types

MeSH terms

Substances