Comparative Study
. 1992 Feb;186(2):655-68.
doi: 10.1016/0042-6822(92)90032-k.

Cauliflower mosaic virus: a 420 subunit (T = 7), multilayer structure

Affiliations
Comparative Study

Cauliflower mosaic virus: a 420 subunit (T = 7), multilayer structure

R H Cheng et al. Virology. 1992 Feb.

Abstract

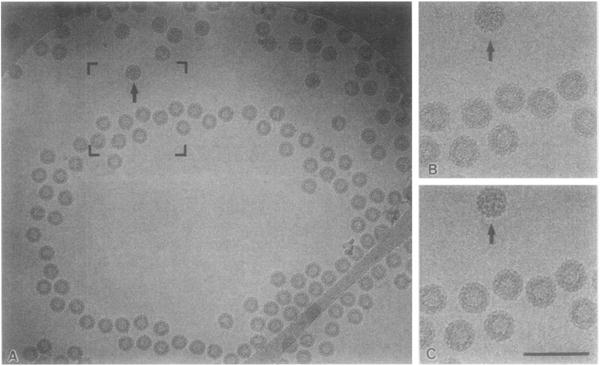
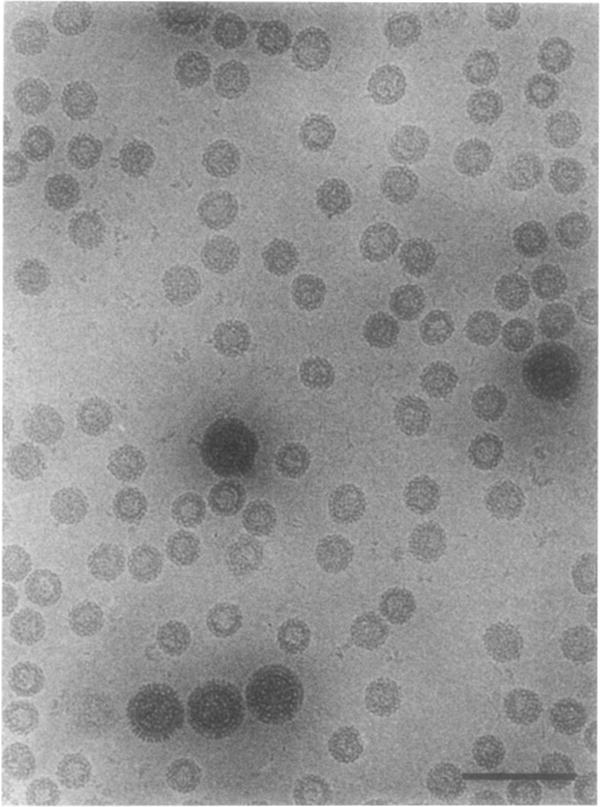
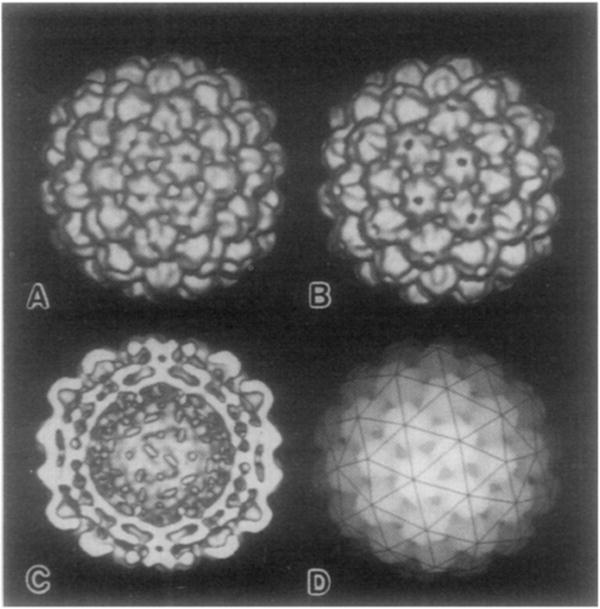
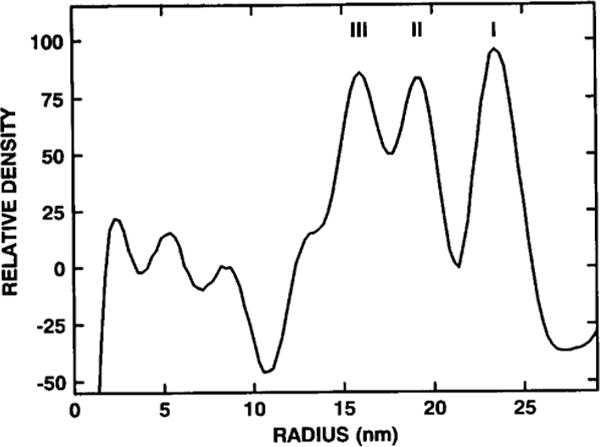
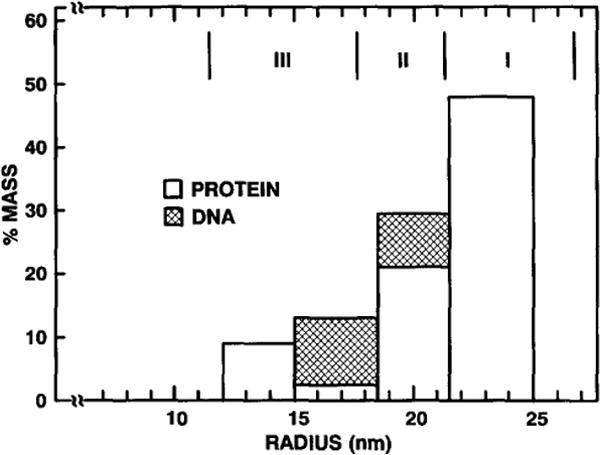
The structures of the Cabb-B and CM1841 strains of cauliflower mosaic virus (CaMV) have been solved to about 3 nm resolution from unstained, frozen-hydrated samples that were examined with low-irradiation cryo-electron microscopy and three-dimensional image reconstruction procedures. CaMV is highly susceptible to distortions. Spherical particles, with a maximum diameter of 53.8 nm, are composed of three concentric layers (I-III) of solvent-excluded density that surround a large, solvent-filled cavity (approximately 27 nm dia). The outermost layer (I) contains 72 capsomeric morphological units, with 12 pentavalent pentamers and 60 hexavalent hexamers for a total of 420 subunits (37-42 kDa each) arranged with T = 7 icosahedral symmetry. CaMV is the first example of a T = 7 virus that obeys the rules of stoichiometry proposed for isometric viruses by Caspar and Klug (1962, Cold Spring Harb. Symp. Quant. Biol. 27, 1-24), although the hexameric capsomers exhibit marked departure from the regular sixfold symmetry expected for a structure in which the capsid protein subunits are quasi-equivalently related. The double-stranded DNA genome is distributed in layers II and III along with a portion of the viral protein. The CaMV reconstructions are consistent with the model based on neutron diffraction studies (Kruse et al., 1987, Virology 159, 166-168) and, together, these structural models are discussed in relation to a replication-assembly model (Hull et al., 1987, J. Cell Sci. (Suppl.) 7, 213-229). Remarkable agreement between the reconstructions of CaMV Cabb-B and CM1841 suggests that other strains of CaMV adopt the same basic structure.


Figures

Fig. 1
Fig. 1
(A) Micrograph of a vitrified CaMV sample, suspended over holes in a carbon support film, containing polyoma virus (arrow) as an internal calibration standard. (B) Magnified view of the same area as (A) shown in brackets, but recorded prior to (A) at ∼1.2 μm underfocus and with an electron dose of ∼1200 e/nm2. (C) Magnified view of (A) recorded at ∼2.4 μm underfocus and with an accumulated specimen dose of ∼2400 e/nm2. The higher phase contrast of (C) compared to (B) helped facilitate initial refinement of particle orientation and alignment parameters. The bar in (C) represents 200 nm in (A) and 100 nm in (B) and (C).
Fig. 2
Fig. 2
Micrograph of a vitrified solution containing CaMV and Type-1 reovirus virions. The diameters of CaMV in this (typical) sample vary by as much as 30%. Those CaMV particles that exhibit the most uniformly round profiles, and therefore are believed to have the best preserved icosahedral symmetry, usually occur in the thicker regions of the vitrified sample near the larger (∼80 nm dia.) reovirus particles. Bar ≃ 200 nm.
Fig. 3
Fig. 3
(A,B) Fourier transforms computed from a focal pair of images of a single CaMV virion recorded at ∼1.2 μm (A) and ∼2.4 μm underfocus (B). White circles mark annular regions from each transform (between (1/10.7) nm–1 and (1/2.4) nm–1 in (A) and between (1/12.8) nm–1 and (1/3.4) nm–1 in (B)) used in the particle orientation refinement procedures. (C) Theoretical plots of the microscope contrast transfer functions (CTFs) corresponding to the defocus settings used in the images from which (A) and (B) were computed. The CTFs, A(θ)sinχ (θ) + B(θ)cosχ (θ), are plotted as a function of spatial frequency, θ/λ, in nm–1, for λ = 0.0042 nm (the wavelength of 80 kV electrons), Cs = 2 mm (objective lens spherical aberration coefficient), and assuming that amplitude contrast remains constant (7%) over the range of spatial frequencies depicted (see Toyoshima and Unwin (1988) for a complete description of how CTFs are computed). The solid portions of the CTF curves correspond to the regions of the Fourier transform bounded by the circles in (A) and (B). The first minima (zeroes) in the respective transforms occur at (1/2.2) nm–1 and (1/3.2) nm–1 (just outside the large white circles).
Fig. 4
Fig. 4
(A, B) Surface-shaded representations of the CaMV Cabb-B (A) and CM1841 (B) reconstructions, computed from 21 and 40 independent particle images, respectively, and viewed along an icosahedral twofold axis of symmetry. (C) Cutaway view of the back half of (A), reveals a multilayered internal structure and a large, central cavity. The equivalent view of CM1841 (not shown) is essentially identical to (C). (D) Depth-cued representation (bright regions appear closest to the viewer) of Cabb-B overlayed with a T = 7 / (left-handed) icosahedral lattice net. The net intersects at points that identify the positions of 72 capsomers, 12 of which occur at pentavalent locations and 60 of which occur at hexavalent locations.
Fig. 5
Fig. 5
Radial density plot of the combined, spherically averaged Cabb-B and CM1841 reconstructions depicts the three concentric-layer (I, II, III) CaMV structure. Three major peaks occur at radii of 23.5 nm (I), 19.1 nm (II), and 16.0 nm (III). The layers extend from a minimum radius of ∼12 nm to a maximum radius of ∼26 nm, with most of the density confined within the outermost 10 nm. Density at r < 11 nm mainly corresponds to the solvent-filled central cavity.
Fig. 6
Fig. 6
Reliability index (RAB) comparisons between independently refined and reconstructed subsets of Cabb-B (10 vs 11 particles) and CM1841 (20 vs 20) data and between the complete reconstructions of Cabb-B and CM1841 (21 vs 40). RAB, plotted as a function of spatial frequency, shows excellent reliability within each of the individual data sets as well as excellent agreement between the full reconstructions to ∼0.34 nm–1.
Fig. 7
Fig. 7
(A) Half-particle, projected image of the density of layer I (r = 21.2–26.9 nm) from the Cabb-B reconstruction, viewed along the axis of the pentavalent capsomer. (B) Magnified view of the central region of (A) showing the regular substructure of the pentameric capsomer (dia. ∼8.3 nm).(C) Same as (A) for a view along the axis of the hexavalent capsomer. (D) Magnified view of the central region of (C) showing the distorted substructure of the hexameric capsomer (maximum dia. ∼ 10.3 nm). Symbols identify subunit–subunit interactions that are described under Results.
Fig. 8
Fig. 8
The CaMV Cabb-B reconstruction presented as surface-shaded views, truncated at progressively lower radii (A–D and E–K), and as projected views of the density at specific radii (L–R). All these representations (A–R) are viewed along a radial direction midway between the axes of the pentavalent (toward the top) and hexavalent (toward the bottom) capsomer axes. A cutaway surface representation (S), in which only the left half of (A) is viewed from the right, reveals the internal features of the multilayer CaMV structure. Circular arcs mark the positions of peaks and troughs seen in the radial density plot (Fig. 5). These are at r = 23.5 (F,M), 21.2 (B,G,N), 19.1 (H,O), 17.6 (C,I,P), 16.0 (J,Q), and 14.5 nm (D,K,R). The reconstructed density along each of the circular arcs in (S) from right to left corresponds to the density along a central, vertical line in each of the panels in (E–R) from top to bottom.
Fig. 9
Fig. 9
Comparison of multilayer models based on our image reconstructions and the neutron scattering experiments of Kruse et al. (1987). The three layers in the reconstruction model span radii of 21.2–26.9 nm (I), 17.6–21.2 nm (II), and 11.4–17.6 nm (III), whereas the neutron model is depicted with four layers that span radii of 21.5–25.0 nm, 18.5–21.5 nm, 15.0–18.5 nm, and 12.0–15.0 nm (Note: Kruse et al. (1987) label these respective layers IV, III, II, and I, whereas we use an opposite convention).

Similar articles

Cited by

References

    1. Al Ani R, Pfeiffer P, Lebeurier G, Hirth L. The structure of cauliflower mosaic virus. I pH-induced structural changes Virology. 1979a;93:175–187. - PubMed
    1. Al Ani R, Pfeiffer P, Lebeurier G. The structure of cauliflower mosaic virus. II. Identity and location of the viral polypeptides. Virology. 1979b;93:188–197. - PubMed
    1. Baker TS, Drak J, Bina M. Reconstruction of the three-dimensional structure of simian virus 40 and visualization of the chromatin core. Proc Natl Acad Sci USA. 1988;85:422–426. - PMC - PubMed
    1. Baker TS, Drak J, Bina M. The capsid of small papova viruses contains 72 pentameric capsomeres: Direct evidence from cryo-electron-microscopy of simian virus 40. Biophys J. 1989;55:243–253. - PMC - PubMed
    1. Baker TS, Newcomb WW, Booy FP, Brown JC, Steven AC. Three-dimensional structures of maturable and abortive capsids of equine herpesvirus 1 from cryoelectron microscopy. J Virol. 1990;64:563–573. - PMC - PubMed

Publication types