

A simulation study comparing aberration detection algorithms for syndromic surveillance
- PMID: 17331250
- PMCID: PMC1821319
- DOI: 10.1186/1472-6947-7-6
A simulation study comparing aberration detection algorithms for syndromic surveillance
Abstract
Background: The usefulness of syndromic surveillance for early outbreak detection depends in part on effective statistical aberration detection. However, few published studies have compared different detection algorithms on identical data. In the largest simulation study conducted to date, we compared the performance of six aberration detection algorithms on simulated outbreaks superimposed on authentic syndromic surveillance data.
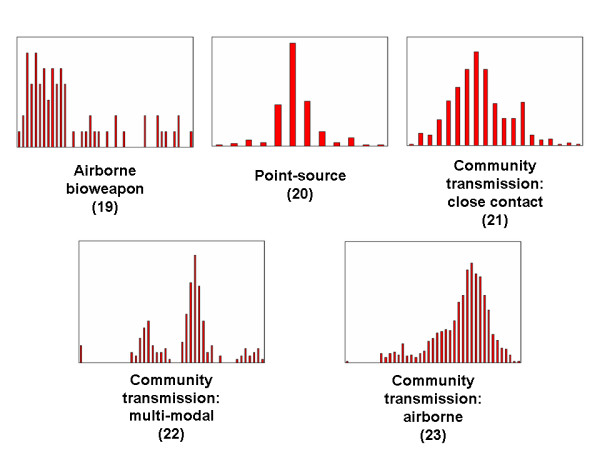
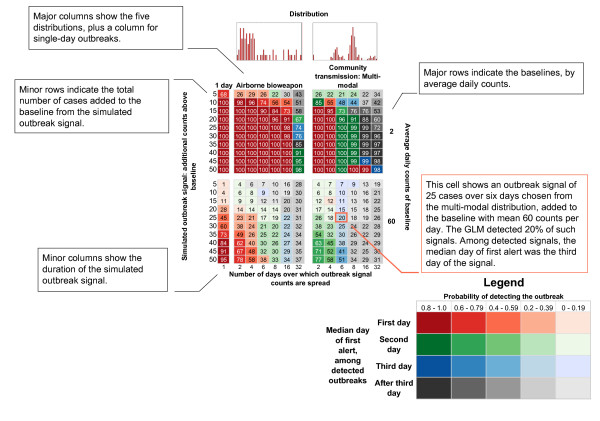
Methods: We compared three control-chart-based statistics, two exponential weighted moving averages, and a generalized linear model. We simulated 310 unique outbreak signals, and added these to actual daily counts of four syndromes monitored by Public Health--Seattle and King County's syndromic surveillance system. We compared the sensitivity of the six algorithms at detecting these simulated outbreaks at a fixed alert rate of 0.01.
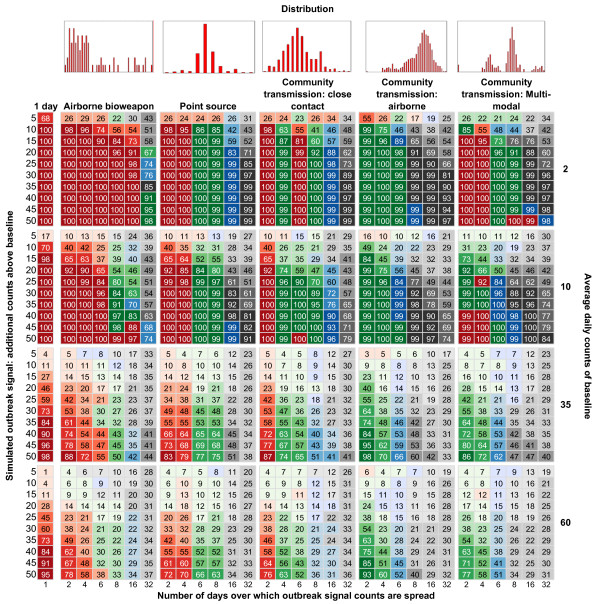
Results: Stratified by baseline or by outbreak distribution, duration, or size, the generalized linear model was more sensitive than the other algorithms and detected 54% (95% CI = 52%-56%) of the simulated epidemics when run at an alert rate of 0.01. However, all of the algorithms had poor sensitivity, particularly for outbreaks that did not begin with a surge of cases.
Conclusion: When tested on county-level data aggregated across age groups, these algorithms often did not perform well in detecting signals other than large, rapid increases in case counts relative to baseline levels.
Figures
Similar articles
-
Evaluation of a public health Salmonella surveillance system in King County, Washington.Am J Infect Control. 2004 Feb;32(1):7-11. doi: 10.1016/j.ajic.2003.06.003. Am J Infect Control. 2004. PMID: 14755228
-
Factors affecting automated syndromic surveillance.Artif Intell Med. 2005 Jul;34(3):269-78. doi: 10.1016/j.artmed.2004.11.002. Artif Intell Med. 2005. PMID: 16023563
-
Outbreak detection through automated surveillance: a review of the determinants of detection.J Biomed Inform. 2007 Aug;40(4):370-9. doi: 10.1016/j.jbi.2006.09.003. Epub 2006 Oct 5. J Biomed Inform. 2007. PMID: 17095301 Review.
-
[Comparison between early outbreak detection models and simulated outbreaks of measles in Beijing].Zhonghua Liu Xing Bing Xue Za Zhi. 2009 Feb;30(2):159-62. Zhonghua Liu Xing Bing Xue Za Zhi. 2009. PMID: 19565878 Chinese.
-
Cluster Detection Mechanisms for Syndromic Surveillance Systems: Systematic Review and Framework Development.JMIR Public Health Surveill. 2020 May 26;6(2):e11512. doi: 10.2196/11512. JMIR Public Health Surveill. 2020. PMID: 32357126 Free PMC article.
Cited by
-
Validity of evaluation approaches for outbreak detection methods in syndromic surveillance systems.Iran J Public Health. 2012;41(11):102-3. Epub 2012 Nov 1. Iran J Public Health. 2012. PMID: 23304684 Free PMC article. No abstract available.
-
Evaluating and implementing temporal, spatial, and spatio-temporal methods for outbreak detection in a local syndromic surveillance system.PLoS One. 2017 Sep 8;12(9):e0184419. doi: 10.1371/journal.pone.0184419. eCollection 2017. PLoS One. 2017. PMID: 28886112 Free PMC article.
-
What's unusual in online disease outbreak news?J Biomed Semantics. 2010 Mar 31;1(1):2. doi: 10.1186/2041-1480-1-2. J Biomed Semantics. 2010. PMID: 20618980 Free PMC article.
-
Outbreak detection algorithms based on generalized linear model: a review with new practical examples.BMC Med Res Methodol. 2023 Oct 14;23(1):235. doi: 10.1186/s12874-023-02050-z. BMC Med Res Methodol. 2023. PMID: 37838735 Free PMC article. Review.
-
The impact of cycling on the physical and mental health, and quality of life of people with disabilities: a scoping review.Front Sports Act Living. 2025 Jan 6;6:1487117. doi: 10.3389/fspor.2024.1487117. eCollection 2024. Front Sports Act Living. 2025. PMID: 39835187 Free PMC article.
References
-
- Henning KJ. Appendix B: Syndromic Surveillance. In: Hamburg MA, Lederberg J, editor. Institute of Medicine, 2003 Microbial Threats to Health: Emergence, Detection, and Response. Washington, DC, The National Academies Press; 2003. pp. 309–350. - PubMed
Publication types
MeSH terms
LinkOut - more resources
Full Text Sources
