Comparative Study
. 2007 May 15;581(Pt 1):221-40.
doi: 10.1113/jphysiol.2006.123810. Epub 2007 Mar 1.

Differences in spike train variability in rat vasopressin and oxytocin neurons and their relationship to synaptic activity

Affiliations
Comparative Study

Differences in spike train variability in rat vasopressin and oxytocin neurons and their relationship to synaptic activity

Chunyan Li et al. J Physiol. .

Abstract

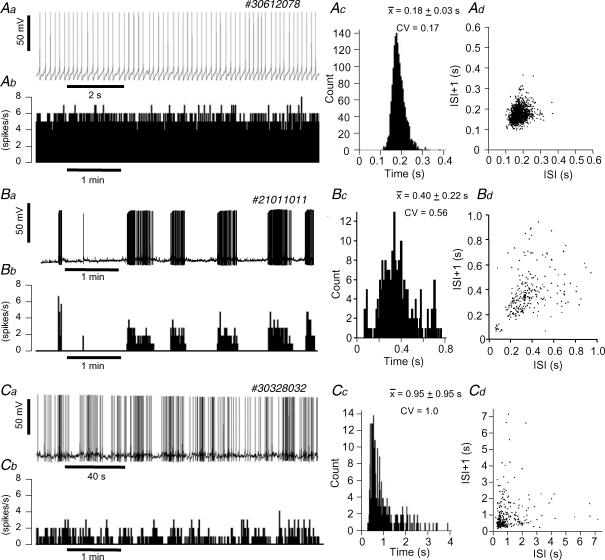
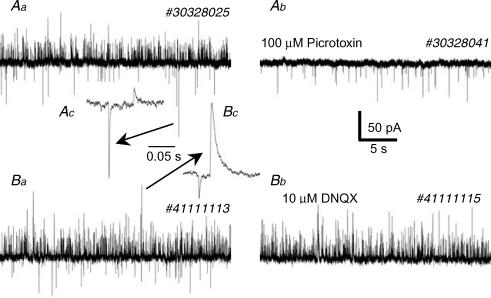
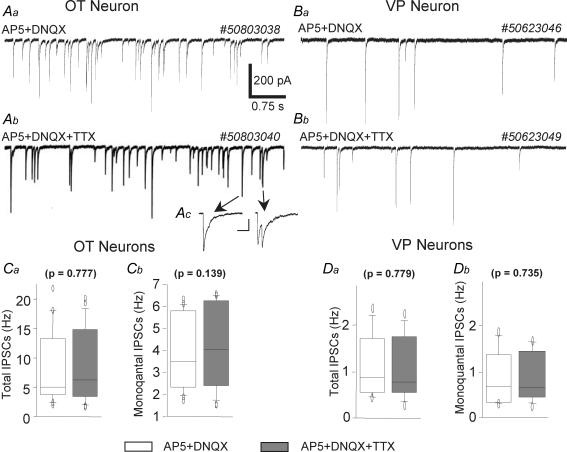
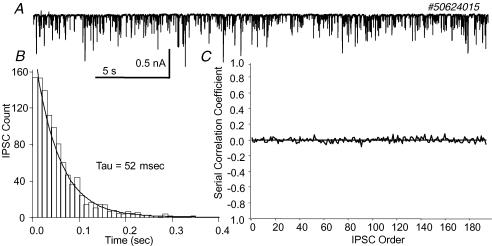
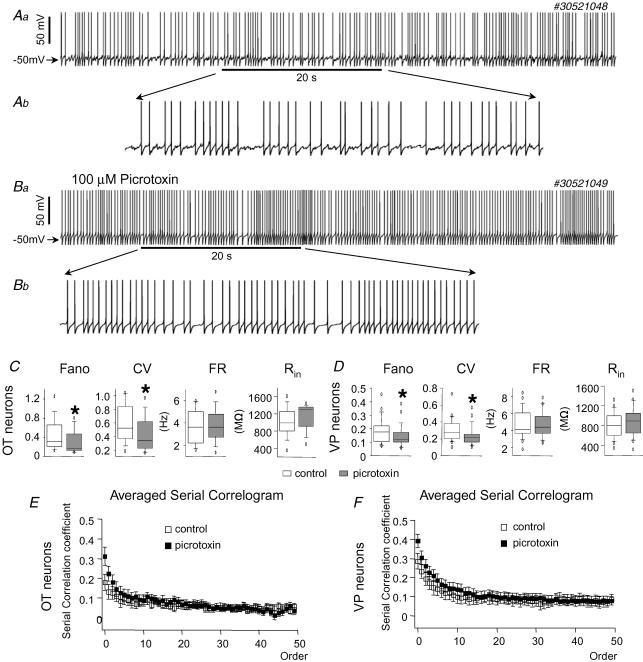
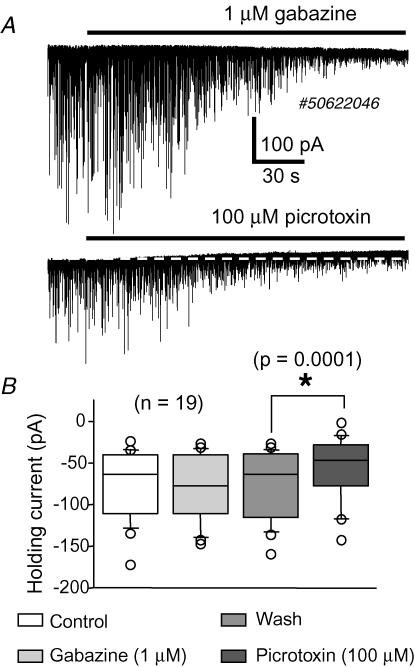
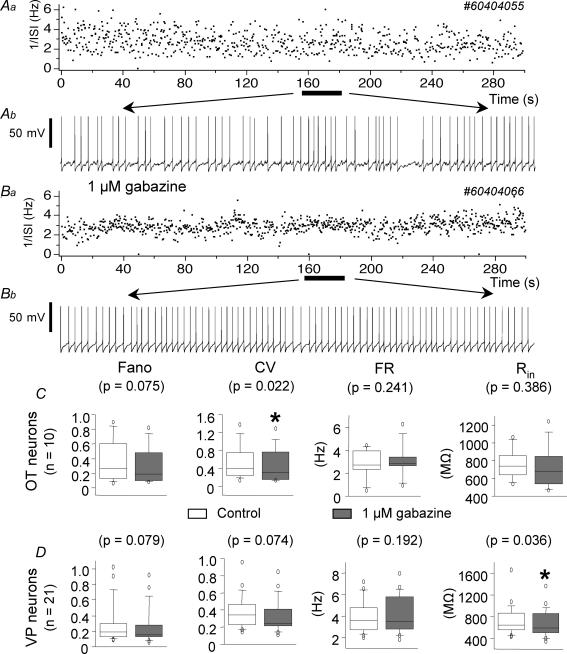
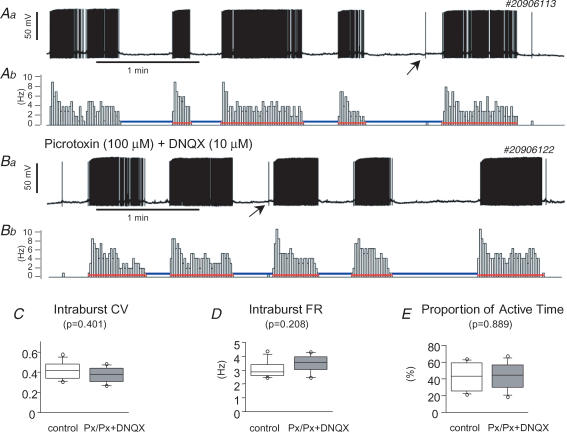
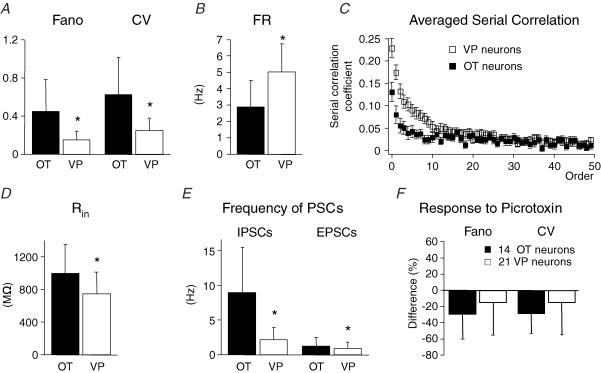
The firing pattern of magnocellular neurosecretory neurons is intimately related to hormone release, but the relative contribution of synaptic versus intrinsic factors to the temporal dispersion of spikes is unknown. In the present study, we examined the firing patterns of vasopressin (VP) and oxytocin (OT) supraoptic neurons in coronal slices from virgin female rats, with and without blockade of inhibitory and excitatory synaptic currents. Inhibitory postsynaptic currents (IPSCs) were twice as prevalent as their excitatory counterparts (EPSCs), and both were more prevalent in OT compared with VP neurons. Oxytocin neurons fired more slowly and irregularly than VP neurons near threshold. Blockade of Cl- currents (including tonic and synaptic currents) with picrotoxin reduced interspike interval (ISI) variability of continuously firing OT and VP neurons without altering input resistance or firing rate. Blockade of EPSCs did not affect firing pattern. Phasic bursting neurons (putative VP neurons) were inconsistently affected by broad synaptic blockade, suggesting that intrinsic factors may dominate the ISI distribution during this mode in the slice. Specific blockade of synaptic IPSCs with gabazine also reduced ISI variability, but only in OT neurons. In all cases, the effect of inhibitory blockade on firing pattern was independent of any consistent change in input resistance or firing rate. Since the great majority of IPSCs are randomly distributed, miniature events (mIPSCs) in the coronal slice, these findings imply that even mIPSCs can impart irregularity to the firing pattern of OT neurons in particular, and could be important in regulating spike patterning in vivo. For example, the increased firing variability that precedes bursting in OT neurons during lactation could be related to significant changes in synaptic activity.


Figures

Figure 1
Figure 1. Immuno-identification of OT and VP neurons
Immunohistochemical identification of biocytin-filled neurons. A and D are biocytin-filled neurons recovered with avidin-AMCA. A–C, OT neuron; D–F, VP neuron. B and E show results for antibody to OT-neurophysin (revealed with goat antimouse Texas Red). C and F show results for an antibody to VP-neurophysin (revealed with goat antirabbit FITC). * in B and F indicates the injected double-labelled neuron
Figure 2
Figure 2. Different firing patterns of SON neurons
Aa–d, SON neuron exhibiting fast continuous firing. Aa, 10 s trace from 5 min recording shows the regularity of the firing. Ab, ratemeter from a 5 min recording. Ac, ISI histogram of all ISIs shows a normal distribution. Ad, ISI joint interval histogram. Each dot in this plot represents an adjacent pair of ISIs. The regularity of the firing results in a tight cluster around the mean ISI. Ba–d, SON neuron exhibiting phasic bursting activity characteristic of VP neurons. Ba, 5 min trace showing 4 bursts with long interburst intervals. Bb, ratemeter. Bc, ISI histogram. The 3 long interburst ISIs are excluded. The ISI histogram reveals a mixed distribution of ISIs with essentially three peaks. Bd, ISI joint interval histogram. The dots are more dispersed, representing larger irregularity of ISI during the bursts compared with the fast continuous neuron, and also show some clustering. Again, the 3 large interburst intervals are not shown. Ca–d, SON neuron exhibiting slow, irregular firing. Ca, a 3 min trace of irregular firing. Cb, ratemeter from a 5 min recording. Cc, ISI histogram of all ISIs reveals a Poisson distribution. Cd, ISI joint interval histogram. Note the dispersed dots, representing a more random distribution of ISIs.
Figure 3
Figure 3. Picrotoxin blocked IPSCs and DNQX blocked EPSCs
Aa–c, SON neuron held at −50 mV in voltage clamp. Aa, control state, showing IPSCs (outward currents) and EPSCs (inward currents). Ab, the same cell exposed to 100 μm picrotoxin, which blocked IPSCs but not EPSCs. Ac, expanded trace, showing an EPSC and IPSC. Ba–c, another SON neuron held at −55 mV. Ba, control state, showing IPSCs and EPSCs. Bb, the same cell exposed to 10 μm DNQX, which blocked EPSCs but not IPSCs. Bc, expanded trace, showing an IPSC and EPSC.
Figure 4
Figure 4. The GABAergic activity recorded in coronal hypothalamic slices was largely from miniature IPSCs (mIPSCs), which are more frequent in OT neurons
Recordings were made with a pipette solution containing 120 mm CsCl to maximize Cl currents. Ten micromolar DNQX and 40 μm AP5 were used to block glutamatergic activities and isolate IPSCs. Aa and b, mIPSCs were recorded at −60 mV as inward currents; the 2 traces are from the same OT neuron before and after applying 0.5 μm TTX. Inset Ac, expanded traces indicate a doublet (right arrow) and a putative monoquantal event (left arrow). Scale for expanded traces: 100 pA/20 ms. Ba and b, mIPSCs were recorded at −60 mV as inward currents; the 2 traces are from the same VP neuron before and after applying 0.5 μm TTX. C, neither the frequency of all IPSCs (a) nor putatively monoquantal IPSCs (b) was different after applying TTX (grey) (n = 18). D, data as in C, for VP neurons. Total IPSCs (Da) and putative monoquantal IPSCs (Db) were unaffected by TTX. Note that the OT neurons in C have many more mIPSCs than do VP neurons in D. Each box plot is composed of 5 horizontal lines that represent the 10th, 25th, 50th, 75th and 90th percentiles of the variable.
Figure 5
Figure 5. GABAergic synaptic activity is randomly distributed
A, voltage clamp recording (−60 mV) of IPSCs in an OT neuron, made with a pipette solution containing 120 mm CsCl to maximize Cl currents. Ten micromolar DNQX and 40 μm AP5 were used to block glutamatergic activities and isolate IPSCs. B, intersynaptic, all events histogram of IPSCs from the full 1 min recording period, fitted with a single exponential function. C, serial correlogram, showing no relationship among the intersynaptic intervals over 200 orders.
Figure 6
Figure 6. Oxytocin and VP neurons fire more regularly after the application of picrotoxin
Aa, the control firing of an irregular OT neuron. Ab, the expanded part of the trace indicated in Aa. Ba, firing after applying 100 μm picrotoxin. Bb, the expanded part of the trace indicated in Ba. Note the increased bouts of regular ISIs and the relative lack of synaptic noise. C, firing variability is decreased in OT neurons following picrotoxin. Both the Fano factor (P = 0.022) and the CV (P = 0.006) were reduced after the application of picrotoxin. The firing rate (P = 0.363) and input resistance (P = 0.155) did not change significantly (n = 14 for Fano and CV, 11 for Rin). D, similar results were found in VP neurons (Fano factor, P = 0.030; CV, P = 0.030; firing rate, P = 0.986; Rin, P = 0.198; n = 21 for Fano and CV, 19 for Rin). E, the averaged serial correlogram of 14 OT neurons shows that after picrotoxin the initial peak increased (P = 0.03 for adjacent pairs of ISIs), suggesting that the spikes are more positively correlated over short periods. F, the averaged serial correlogram of 21 VP neurons shows a similar increase in the initial peak after picrotoxin (P = 0.05). For clarity, the error bars in E and F are s.e.m.
Figure 7
Figure 7. Tonic inhibition was present in OT neurons
Recordings were made with a pipette solution containing 120 mm CsCl to maximize Cl currents, at a holding voltage of −60 mV. Forty micromolar AP5 and 10 μm DNQX were added to the ACSF to inhibit ionotropic glutamate receptors, and 0.5 μm TTX was added to block voltage-sensitive Na+ channels. A, an OT neuron was first exposed to 1 μm gabazine for 3 min to block mIPSCs. After some recovery of mIPSCs during the wash, 100 μm picrotoxin was applied for 3 min. Not only were mIPSCs blocked, but also the holding current was outwardly shifted. The dashed line indicates the holding current in the absence of picrotoxin. B, box plot of the holding current from 19 OT neurons at 4 periods. Differences were detected between control holding current after wash and after the application of picrotoxin.
Figure 8
Figure 8. Gabazine regularized the firing patterns of OT neurons in virgin rats
Aa, instantaneous frequency during control state. Each dot represents the reciprocal of the corresponding interspike interval. Notice the wide dispersion of the dots. Ab, 25 s sample from the spike train represented. Notice the variability of ISIs. Ba, instantaneous frequency graph after 1 μm gabazine. Compared with Aa, the dots are more condensed, representing a reduction of variability of firing after gabazine. Bb, 25 s sample from the spike train. Notice the regularity of ISIs. C, for OT neurons, CV of ISIs was significantly reduced after gabazine. Firing rate and input resistance were not affected by gabazine. D, for VP neurons, the firing variability (Fano factor and CV) and firing rate were not affected by gabazine, but the input resistance was slightly decreased.
Figure 9
Figure 9. Phasic firing was not affected by synaptic blockade
A1, phasic bursting SON neuron in control ACSF for a 5 min recording. Ab, ratemeter of spike activity in Aa. The red lines in Ab and Bb indicate bursts detected by the computer program. The first firing period was not analysed because the initiation of burst required at least 3 s of preceding silence (see Methods). The blue line indicates the silent period detected by the program. The silent period following the last burst was not counted because the duration of the silent period is unknown. Notice that isolated spikes (the arrows in Aa and Ba) were considered part of the silent period between adjacent bursts. Ba, trace from the same neuron as in A after the application of picrotoxin and DNQX. Bb, ratemeter from neuron shown in Ba. See A for explanation. C, D and E show the statistical data from 8 neurons that exhibited phasic activity before and after synaptic blockade (5 were treated with combined picrotoxin and DNQX; 3 were treated with picrotoxin only). There were no significant differences between control and synaptic blockade periods for intraburst CV (C), intraburst firing rate (D) and the proportion of active time (E). We also compared the length of bursts and interburst intervals between the 2 periods and found no significant differences. Burst length of control, 33.5 s; burst length of drug treatment, 42.2 s; silence length of control, 25.4 s; and silence length of drug treatment, 32.3 s.
Figure 10
Figure 10. Comparison of OT and VP neuronal properties
A, OT neurons have a larger firing variability, as indicated by the larger Fano factor (P < 0.0001) and CV (P < 0.0001), compared with VP neurons. B, OT neurons fire more slowly than VP neurons near threshold (P < 0.0001). C, averaged serial correlograms showed that the initial peak of VP neurons was larger than that of OT neurons (P = 0.002), suggesting that for short periods (10 spikes), neighbouring spikes of VP neurons are more positively correlated than those of OT neurons. D, OT neurons have larger input resistance than VP neurons (P = 0.002). E, OT neurons exhibited more IPSCs (P < 0.0001) and EPSCs (P = 0.042) than did VP neurons. For A–E, n = 41 VP neurons and 33 OT neurons. F, since OT neurons have more IPSCs, we predicted that their response to picrotoxin would be larger than that of VP neurons. Although the tendency was that the variability of firing (Fano factor and CV) was reduced in OT compared with VP neurons in response to picrotoxin, neither effect reached statistical significance (CV, P = 0.07; Fano factor, P = 0.09).

Similar articles

Cited by

References

    1. Andrew RD, Dudek FE. Burst discharge in mammalian neuroendocrine cells involves an intrinsic regenerative mechanism. Science. 1983;221:1050–1052. - PubMed
    1. Armstrong WE. Morphological and electrophysiological classification of hypothalamic supraoptic neurons. Prog Neurobiol. 1995;47:291–339. - PubMed
    1. Armstrong WE, Smith BN, Tian M. Electrophysiological characteristics of immunochemically identified rat oxytocin and vasopressin neurones in vitro. J Physiol. 1994;475:115–128. - PMC - PubMed
    1. Armstrong WE, Stern JE. Electrophysiological and morphological characteristics of neurons in perinuclear zone of supraoptic nucleus. J Neurophysiol. 1997;78:2427–2437. - PubMed
    1. Bai D, Zhu G, Pennefather P, Jackson MF, MacDonald JF, Orser BA. Distinct functional and pharmacological properties of tonic and quantal inhibitory postsynaptic currents mediated by γ-aminobutyric acidA receptors in hippocampal neurons. Mol Pharmacol. 2001;59:814–824. - PubMed

Publication types

MeSH terms

LinkOut - more resources