. 2007 May;18(5):1874-86.
doi: 10.1091/mbc.e06-09-0881. Epub 2007 Mar 1.

Diverse cytopathologies in mitochondrial disease are caused by AMP-activated protein kinase signaling

Affiliations

Diverse cytopathologies in mitochondrial disease are caused by AMP-activated protein kinase signaling

Paul B Bokko et al. Mol Biol Cell. 2007 May.

Abstract

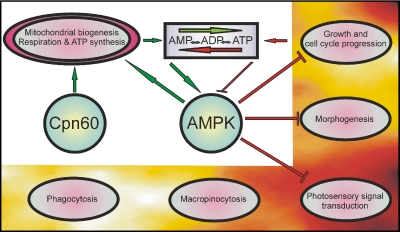
The complex cytopathology of mitochondrial diseases is usually attributed to insufficient ATP. AMP-activated protein kinase (AMPK) is a highly sensitive cellular energy sensor that is stimulated by ATP-depleting stresses. By antisense-inhibiting chaperonin 60 expression, we produced mitochondrially diseased strains with gene dose-dependent defects in phototaxis, growth, and multicellular morphogenesis. Mitochondrial disease was phenocopied in a gene dose-dependent manner by overexpressing a constitutively active AMPK alpha subunit (AMPKalphaT). The aberrant phenotypes in mitochondrially diseased strains were suppressed completely by antisense-inhibiting AMPKalpha expression. Phagocytosis and macropinocytosis, although energy consuming, were unaffected by mitochondrial disease and AMPKalpha expression levels. Consistent with the role of AMPK in energy homeostasis, mitochondrial "mass" and ATP levels were reduced by AMPKalpha antisense inhibition and increased by AMPKalphaT overexpression, but they were near normal in mitochondrially diseased cells. We also found that 5-aminoimidazole-4-carboxamide-1-beta-D-ribofuranoside, a pharmacological AMPK activator in mammalian cells, mimics mitochondrial disease in impairing Dictyostelium phototaxis and that AMPKalpha antisense-inhibited cells were resistant to this effect. The results show that diverse cytopathologies in Dictyostelium mitochondrial disease are caused by chronic AMPK signaling not by insufficient ATP.


Figures

Figure 1.
Figure 1.
Genetic manipulation of levels of expression of the catalytic α subunit of AMPK and its truncated form AMPKαT. (a) Map of the Dictyostelium AMPKα polypeptide showing positions of the main functional features. Numbers indicate amino acid positions. The amino acid sequence is conserved except for a short N-terminal stretch and an asparagine-rich region in the C-terminal half of the molecule. Such asparagine-rich domains are very common in Dictyostelium proteins, but their functions are unknown. The β-subunit binding and autoinhibitory regions are required for assembly of the α subunit into the heterotrimeric holoenzyme and its regulation by AMP/ATP-binding to the γ subunit. The inset contains a Northern blot showing a developmental time course for native AMPKα mRNA expression. The probe was a genomic DNA fragment extending from position 2228 to 2642 base pairs in the genomic DNA sequence, numbering from the translational start codon. (b) The truncated form of AMPKα used in overexpression studies. The truncated form was created by introducing a single base deletion (A1120) during RT-PCR to produce a cDNA with a reading frame shift at that position and a premature stop codon 18 nucleotides downstream. In addition, our cDNA contains the following base substitutions: T7C introduced with the 5′ primer as well as T1134G and AAA1129CCC introduced with the 3′ primer downstream of the frameshift. These additional changes arose because of sequence differences between GenBank record AF118151 and the since completed Dictyostelium genome sequence. S3P and VLPRGQ379 indicate amino acid substitutions, the latter resulting from the introduced frame shift at residue 374 that created a stop at codon 380. Numbers indicate amino acid positions. (c) The genomic DNA fragment used for antisense inhibition studies. The arrow indicates the direction of transcription of the fragment in the antisense RNA construct. The red section indicates the cDNA and the black bars indicate the position and size of introns in the fragment. Numbers represent nucleotide positions in the genomic sequence. (d) The amplicon used to measure antisense inhibition of expression of the native AMPKα mRNA by using real-time PCR. The sequences to which the primers anneal are not present in the AMPKα antisense construct. (e) Expression of the native AMPKα mRNA relative to the wild-type AX2 control in cells carrying the indicated number of copies of the AMPKα antisense RNA construct. Negative numbers are assigned to the copy numbers of the antisense inhibition construct, because it exerts a negative effect on expression of the native AMPKα mRNA. The Southern blot in the inset made use of a chromogenic substrate to show hybridization to the 8.25-kb antisense RNA construct as a function of the number of copies per genome. (f) Overexpression of the truncated AMPK α subunit (AMPKαT) mRNA as a function of the number of copies of the overexpression construct per genome. Expression levels relative to expression in the transformant with the highest copy number were measured in quantitative Northern blots. Insets contain separate Southern, Northern, and Western blots using chromogenic substrates to show the AMPKαT construct DNA, mRNA, and polypeptide levels at the indicated copy numbers. The antibody was not sufficiently sensitive to detect the native AMPKα subunit in Western blots, suggesting that the level of expression of AMPKαT is significantly higher than that of the endogenous full-length protein. This is consistent with Northern blots and quantitative RT-PCR results that showed that the levels of AMPKαT mRNA were 1 to 2 orders of magnitude higher than the mRNA for the native protein (data not shown).
Figure 2.
Figure 2.
Effect of chaperonin 60 and AMPKα expression levels on Dictyostelium slug phototaxis. Each circle represents a different clonal cell line (strain) carrying the indicated number of copies of either the chaperonin 60 antisense construct, the AMPKα antisense construct, or the AMPKαT overexpression construct. Lines are fitted only to the data represented by the circles. Each square represents a different strain carrying different numbers of copies of both the chaperonin 60 antisense construct and the AMPKα antisense construct. Data for these strains therefore occurs in both panels, in each of which it is plotted according to the copy number relevant to that panel only. The accuracy of phototaxis is the concentration parameter (κ) of the circular normal (von Mises) distribution, which measures how concentrated individual directions are around the direction toward the light source. κ ranges from 0 in the case of no preferred direction of migration (all directions equally probable) to ∞ in the case of perfect orientation (all directions exactly toward the light). Vertical bars are 90% confidence intervals. Negative values indicate the copy numbers of antisense inhibition constructs, whereas positive values indicate copy numbers of overexpression constructs. Copy numbers of zero include both the wild-type strain (AX2) and control strains carrying sense construct controls, but no copies of the relevant antisense or overexpression construct. (a) Phototaxis by mitochondrially diseased (chaperonin 60 antisense inhibited) Dictyostelium slugs formed and migrating on charcoal agar at 21°C. (b) Phototaxis by slugs of Dictyostelium strains with different levels of expression of the AMPK α subunit (antisense inhibition, negative copy numbers) or a truncated form of the α subunit containing the catalytic domain (AMPKαT overexpression, positive copy numbers). An animated three-dimensional scatter plot combining data from both panels a and b is contained in the Supplemental Material video file AMPK_photo_spin.mov.
Figure 3.
Figure 3.
Effect of chaperonin 60 and AMPKα expression levels on Dictyostelium growth. Symbols used are as in Figure 2. Vertical bars are 95% confidence intervals. Negative values indicate the copy numbers of antisense inhibition constructs, whereas positive values indicate copy numbers of the overexpression construct. Copy numbers of zero include both the wild type strain (AX2) and control strains carrying sense construct controls, but no copies of the relevant antisense or overexpression construct. (a and b) Time taken for a growing Dictyostelium colony (plaque) to expand 5 mm during growth at 21°C on an E. coli B2 lawn on SM agar. The growth time was calculated from the slope of the line measured by linear regression analysis of plaque diameter versus time during 5–7 d of growth. An animated three-dimensional scatter plot combining data from both a and b is contained in the Supplemental Material video file AMPK_plate_ growth_spin.mov. (c and d) Generation time for Dictyostelium cells growing in HL-5 liquid medium at 21°C, shaken at 150 rpm. Generation times were calculated from growth curve slopes using log-linear regression analysis of cell counts during the exponential phase of growth. An animated three-dimensional scatter plot combining data from both c and d is contained in the Supplemental Material video file AMPK_HL-5_growth_spin.mov.
Figure 4.
Figure 4.
Effect of chaperonin 60 and AMPKα expression levels on Dictyostelium phagocytosis and pinocytosis rates. Symbols are as in Figure 2. Negative values indicate the copy numbers of antisense inhibition constructs, whereas positive values indicate copy numbers of overexpression construct. Copy numbers of zero refer to the wild-type parental strain AX2. (a and b) Rates of phagocytosis by Dictyostelium cells engulfing E. coli cells expressing the fluorescent red protein Ds-Red. Rates were measured from duplicate fluorescence measurements immediately and 30 min after addition of fluorescent bacteria to the amoebal suspension. An animated three-dimensional scatter plot combining data from both a and b is contained in the Supplemental Material video file AMPK_phago_spin.mov. (c and d) Rates of macropinocytosis by Dictyostelium cells in HL-5 medium containing 2 mg/ml FITC-dextran. The uptake of fluorescent medium was measured in duplicate immediately and 60 or 70 min after addition of FITC-dextran to the amoebal suspension. An animated three-dimensional scatter plot combining data from both c and d is contained in the Supplemental Material video file AMPK_pino_spin.mov.
Figure 5.
Figure 5.
Effect of chaperonin 60 and AMPKα expression levels on multicellular morphogenesis in Dictyostelium. Photographs were taken from above (main panels) or from the side (insets) of fruiting bodies formed during growth at 21°C on a bacterial lawn (K. aerogenes). Apart from b, the parental wild-type strain (AX2), the strains contained (a) antisense inhibition constructs for both chaperonin 60 (main panel, 73 copies; inset, 56 copies) and AMPKα (main panel, 109 copies; inset, 98 copies) or (c) the chaperonin 60 antisense construct only (main panel, 48 copies; inset, top row, 67 copies; inset, other rows, 74 copies) or (e) the AMPKα antisense inhibition construct (143 copies) only or (d and f) the AMPKαT overexpression construct only (30 copies and 148 copies, respectively). Mitochondrial disease (chaperonin 60 antisense inhibition) and AMPKαT overexpression both caused the formation of fruiting bodies with thick, short stalks (red arrows in c, d, and f). Fruiting body morphology was normal for a mitochondrially diseased strain (chaperonin 60 antisense inhibition) in which AMPKα expression was antisense inhibited (cyan arrows in a). In otherwise healthy cells, AMPKα antisense inhibition resulted in formation of fewer, smaller fruiting bodies that were morphologically normal (green arrows in e). For comparative purposes, the strains were selected to show the phenotypes at moderate copy numbers of the various constructs. The aberrant phenotypes in c, d, e, and f were more severe at higher copy numbers.
Figure 6.
Figure 6.
Effect of chaperonin 60 and AMPKα expression levels on mitochondrial mass and ATP levels in Dictyostelium. Symbols are as in Figure 2. Negative values indicate the copy numbers of antisense inhibition constructs, whereas positive values indicate copy numbers of the overexpression construct. Copy numbers of zero refer to the wild-type parental strain AX2. (a and b) Mitochondrial mass as measured by fluorescence with the mitochondrion-specific dye MitoTracker Green after subtraction of autofluorescence from unstained cells from the same suspension. The insets in b show MitoTracker Red fluorescence microscopy of typical cells from wild-type AX2 and from representative AMPKα antisense-inhibited strains (with and without chaperonin 60 antisense inhibition) and a representative AMPKαT-overexpressing strain. Compared with wild-type cells, the MitoTracker Red fluorescence seems brighter and the mitochondria more numerous in the case of AMPKαT overexpression, but fainter and the mitochondria less numerous in the AMPKα antisense-inhibited cells. The cells that are antisense-inhibited for both AMPKα and chaperonin 60 do not seem to differ from the wild-type cells in the brightness of the MitoTracker Red fluorescence or in the numbers of mitochondria. An animated three-dimensional scatter plot combining data from both a and b is contained in the Supplemental Material video file AMPK_mtmass_spin.mov. (c and d) ATP levels in Dictyostelium cells as measured using luciferase-based luminescence in a Modulus fluorometer (Turner BioSystems) with the luminescence module. An animated three-dimensional scatter plot combining data from both c and d is contained in the Supplemental Material video file AMPK_ATP_spin.mov. The significance of the correlations in b and d was verified both by using the nonparametric Kendall rank r and by two-sample tests (t test with unequal variances, Kolmogorov–Smirnov test and Kruskal–Wallace test) of the difference between the overexpression strains and the antisense-inhibited strains.
Figure 7.
Figure 7.
Impairment of phototaxis by the pharmacological AMPK activator AICAR. Dictyostelium slugs of the parental strain (AX2; a) or an AMPKα antisense-inhibited transformant (143 copies of the antisense construct; b) were allowed to form and migrate toward a lateral light source on water agar supplemented with the indicated concentrations of AICAR. Slug trails were blotted onto PVC discs stained with Coomassie blue protein stain, digitized, and plotted from a common origin. The light source was to the right of the Figure. In the presence of AICAR, the wild-type slugs were disoriented so that their trails wound about much more during phototaxis. This did not occur with the AMPKα antisense-inhibited strain. The inset shows a separate experiment with wild-type cells in which the dose response to AICAR was clearer.
Figure 8.
Figure 8.
Model for the role of AMPK signaling in mitochondrial disease. Cpn60 is chaperonin 60 whose undersupply in antisense-inhibited cells causes mitochondrial dysfunction. Arrowheads indicate stimulation, and barred ends indicate inhibition. AMP, ADP, and ATP are interconvertible. Mitochondrial biogenesis and function favor ATP production, whereas the cellular activities in the ellipses in the flame-shaded region consume ATP and favor AMP generation. AMP activates and ATP inhibits AMPK, which in turn stimulates mitochondrial biogenesis and inhibits some energy-consuming cellular activities (e.g., growth and cell cycle progression, morphogenesis, and photosensory signal transduction), but not others (e.g., phagocytosis and macropinocytosis). In mitochondrially diseased cells, AMPK is chronically activated, which homeostatically returns mitochondrial mass and ATP levels to near normal, but it also chronically inhibits cell proliferation and impairs multicellular morphogenesis and photosensory behavior (phototaxis).

References

    1. Agostino A., et al. Constitutive knockout of Surf1 is associated with high embryonic lethality, mitochondrial disease and cytochrome c oxidase deficiency in mice. Hum. Mol. Genet. 2003;12:399–413. - PubMed
    1. Bandala-Sanchez E., Annesley S. J., Fisher P. R. A phototaxis signalling complex in Dictyostelium discoideum. Eur. J. Cell Biol. 2006;85:1099–1106. - PubMed
    1. Barth C., Fraser D. J., Fisher P. R. A rapid, small scale method for characterization of plasmid insertions in the Dictyostelium genome. Nucleic Acids Res. 1998a;26:3317–3318. - PMC - PubMed
    1. Barth C., Fraser D. J., Fisher P. R. Coinsertional replication is responsible for tandem multimer formation during plasmid integration into the Dictyostelium genome. Plasmid. 1998b;39:141–153. - PubMed
    1. Bergeron R., Ren J. M., Cadman K. S., Moore I. K., Perret P., Pypaert M., Young L. H., Semenkovich C. F., Shulman G. I. Chronic activation of AMP kinase results in NRF-1 activation and mitochondrial biogenesis. Am. J. Physiol. Endocrinol. Metab. 2001;281:E1340–E1346. - PubMed

Publication types

MeSH terms