

Unraveling the molecular targets pertinent to junction restructuring events during spermatogenesis using the Adjudin-induced germ cell depletion model
- PMID: 17332525
- PMCID: PMC2804028
- DOI: 10.1677/JOE-06-0158
Unraveling the molecular targets pertinent to junction restructuring events during spermatogenesis using the Adjudin-induced germ cell depletion model
Abstract
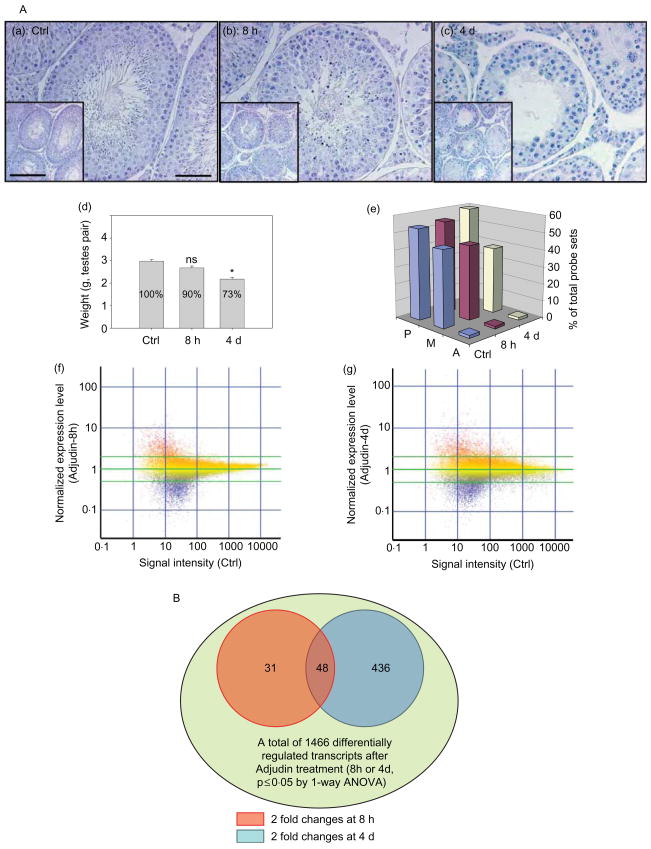
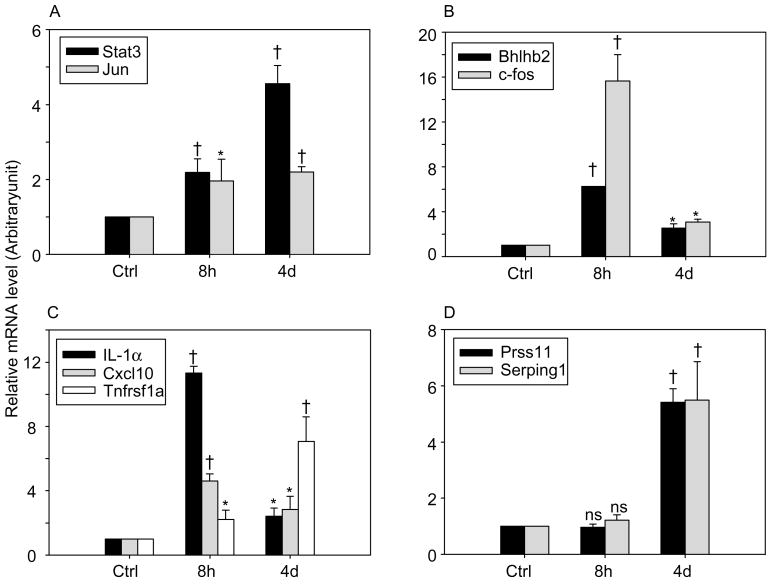
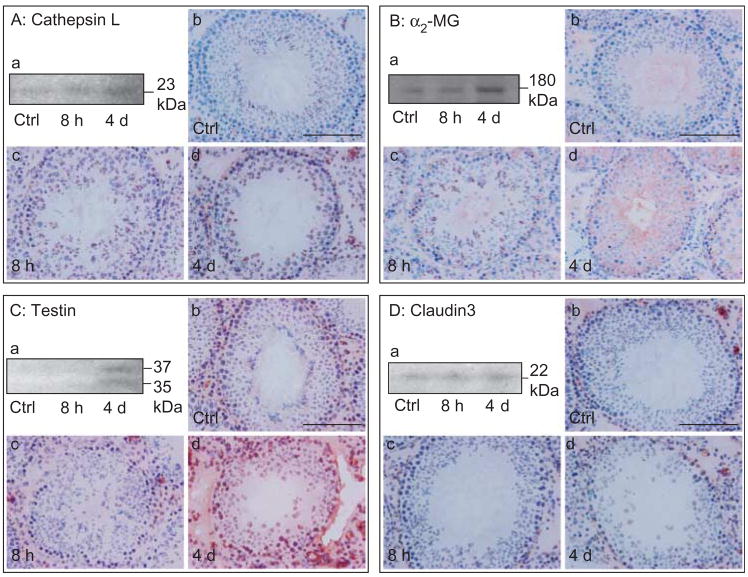
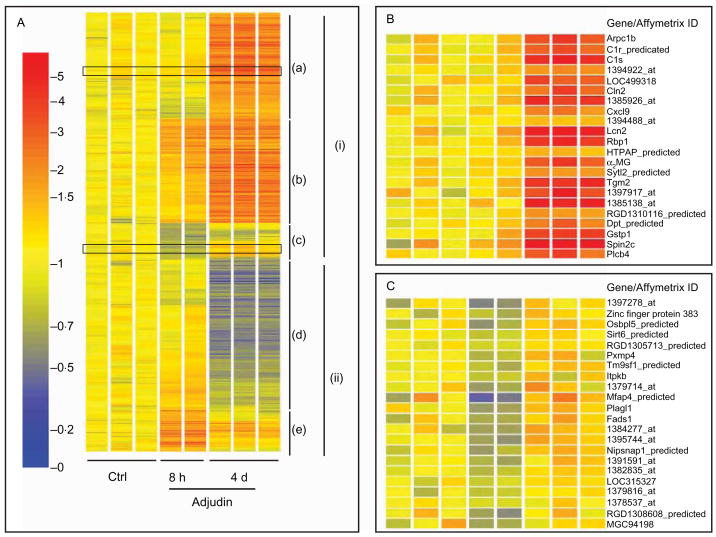
During spermatogenesis, extensive restructuring takes place at the Sertoli-Sertoli and Sertoli-germ cell interface, which is regulated via intriguing interactions among cytokines, proteases, protease inhibitors, kinases, phosphatases, and transcription factors. This in turn determines the steady-state levels of integral membrane proteins at the cell junctions. We sought to further expand these observations using the Adjudin model. Adjudin is a potential male contraceptive that targets Sertoli-germ cell adhesion, causing exfoliation of spermatids and spermatocytes, but not spermatogonia, from the seminiferous epithelium. This model thus provides the means to identify crucial regulatory molecules and signaling pathways pertinent to junction restructuring events during spermatogenesis. In this study, genome-wide expression profiling of rat testes after treatment with Adjudin at the time of extensive junction restructuring was performed. Differentially regulated genes, such as cytokines, proteases, protease inhibitors, cell junction-associated proteins, and transcription factors pertinent to junction restructuring were identified. These data were consistent with earlier findings; however, much new information was obtained which has been deposited at the Gene Expression Omnibus data repository website: http://www.ncbi.nih.gov/geo/ with Accession number: GSE5131. The primary signaling events pertinent to junction restructuring in the testis induced by Adjudin were also delineated using bioinformatics. These findings were also consistent with recently published reports. The identified molecular signatures or targets pertinent to junction dynamics in the testis as reported herein, many of which have not been investigated, thus offer a framework upon which the regulation of junction restructuring events at the Sertoli-Sertoli and Sertoli-germ cell interface pertinent to spermatogenesis can be further studied.
Figures
Similar articles
-
Connexin 43 reboots meiosis and reseals blood-testis barrier following toxicant-mediated aspermatogenesis and barrier disruption.FASEB J. 2016 Apr;30(4):1436-52. doi: 10.1096/fj.15-276527. Epub 2015 Dec 17. FASEB J. 2016. PMID: 26678449 Free PMC article.
-
Adjudin-mediated junction restructuring in the seminiferous epithelium leads to displacement of soluble guanylate cyclase from adherens junctions.J Cell Physiol. 2006 Jul;208(1):175-87. doi: 10.1002/jcp.20651. J Cell Physiol. 2006. PMID: 16547975
-
Regulation of Sertoli-germ cell adherens junction dynamics in the testis via the nitric oxide synthase (NOS)/cGMP/protein kinase G (PRKG)/beta-catenin (CATNB) signaling pathway: an in vitro and in vivo study.Biol Reprod. 2005 Sep;73(3):458-71. doi: 10.1095/biolreprod.105.040766. Epub 2005 Apr 27. Biol Reprod. 2005. PMID: 15858215
-
Adjudin, a potential male contraceptive, exerts its effects locally in the seminiferous epithelium of mammalian testes.Reproduction. 2011 May;141(5):571-80. doi: 10.1530/REP-10-0464. Epub 2011 Feb 9. Reproduction. 2011. PMID: 21307270 Free PMC article. Review.
-
Cytokines and junction restructuring events during spermatogenesis in the testis: an emerging concept of regulation.Cytokine Growth Factor Rev. 2009 Aug;20(4):329-38. doi: 10.1016/j.cytogfr.2009.07.007. Epub 2009 Aug 3. Cytokine Growth Factor Rev. 2009. PMID: 19651533 Free PMC article. Review.
Cited by
-
Testin and actin are key molecular targets of adjudin, an anti-spermatogenic agent, in the testis.Spermatogenesis. 2011 Apr;1(2):137-146. doi: 10.4161/spmg.1.2.16449. Spermatogenesis. 2011. PMID: 22319662 Free PMC article.
-
Adjudin--A Male Contraceptive with Other Biological Activities.Recent Pat Endocr Metab Immune Drug Discov. 2015;9(2):63-73. doi: 10.2174/1872214809666151029113043. Recent Pat Endocr Metab Immune Drug Discov. 2015. PMID: 26510796 Free PMC article. Review.
-
The biology of spermatogenesis: the past, present and future.Philos Trans R Soc Lond B Biol Sci. 2010 May 27;365(1546):1459-63. doi: 10.1098/rstb.2010.0024. Philos Trans R Soc Lond B Biol Sci. 2010. PMID: 20403863 Free PMC article.
-
Spermiation: Insights from Studies on the Adjudin Model.Adv Exp Med Biol. 2021;1288:241-254. doi: 10.1007/978-3-030-77779-1_12. Adv Exp Med Biol. 2021. PMID: 34453740 Review.
-
Adjudin targeting rabbit germ cell adhesion as a male contraceptive: a pharmacokinetics study.J Androl. 2009 Jan-Feb;30(1):87-93. doi: 10.2164/jandrol.108.004994. Epub 2008 Sep 18. J Androl. 2009. PMID: 18802200 Free PMC article.
References
-
- Alcivar AA, Hake LE, Hardy MP, Hecht NB. Increased levels of junB and c-jun mRNAs in male germ cells following testicular cell dissociation. Maximal stimulation in prepuberal animals. Journal of Biological Chemistry. 1990;265:20160–20165. - PubMed
-
- Anway MD, Wright WW, Zirkin BR, Korah N, Mort JS, Hermo L. Expression and localization of cathepsin K in adult rat Sertoli cells. Biology of Reproduction. 2004;70:562–569. - PubMed
-
- Carragher NO, Frame MC. Focal adhesion and actin dynamics: a place where kinases and proteases meet to promote invasion. Trends in Cell Biology. 2004;14:241–249. - PubMed
Publication types
MeSH terms
Substances
Grants and funding
LinkOut - more resources
Full Text Sources
Molecular Biology Databases
