Comparative Study
. 2007 Mar 21;26(6):1670-80.
doi: 10.1038/sj.emboj.7601626. Epub 2007 Mar 1.

Notch3 and the Notch3-upregulated RNA-binding protein HuD regulate Ikaros alternative splicing

Affiliations
Comparative Study

Notch3 and the Notch3-upregulated RNA-binding protein HuD regulate Ikaros alternative splicing

Diana Bellavia et al. EMBO J. .

Abstract

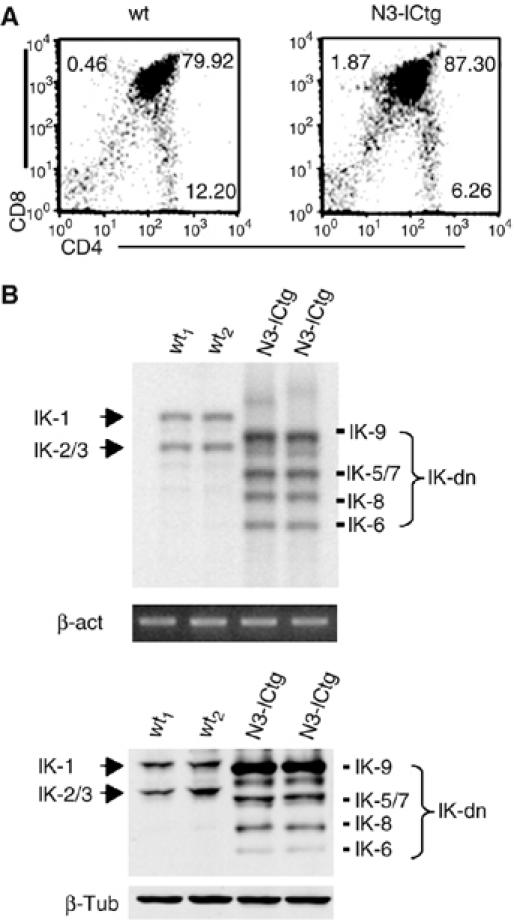
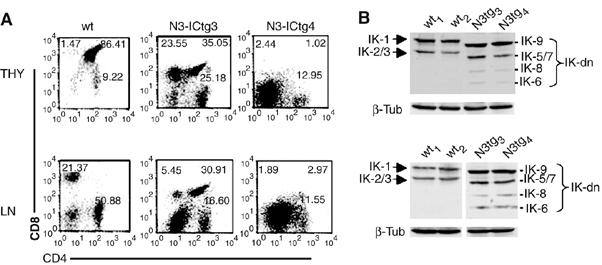
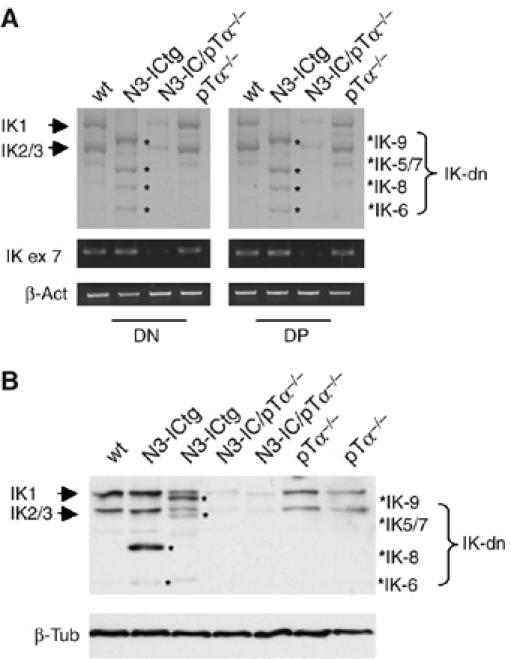
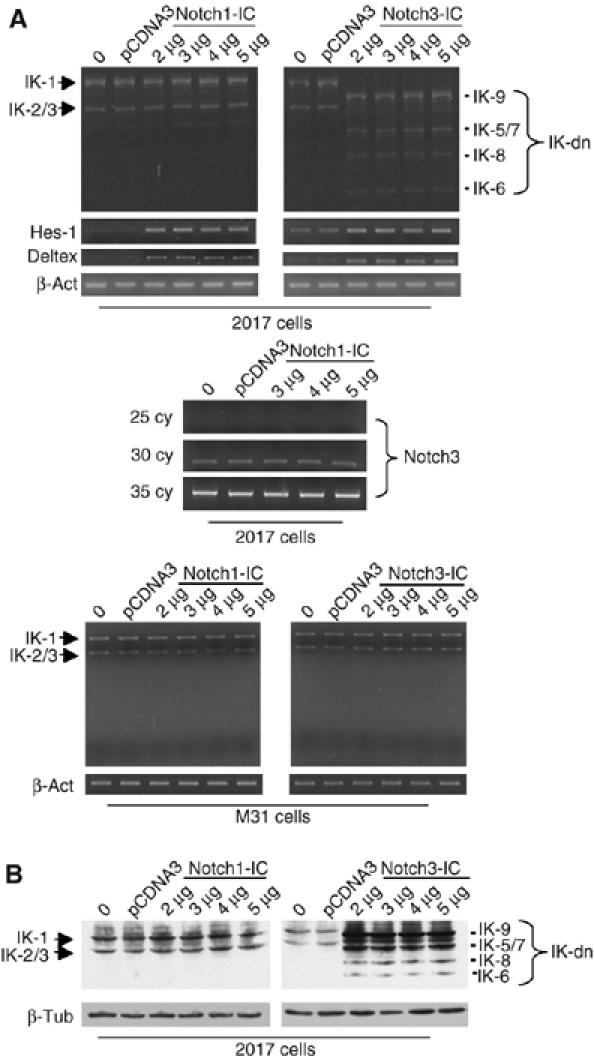
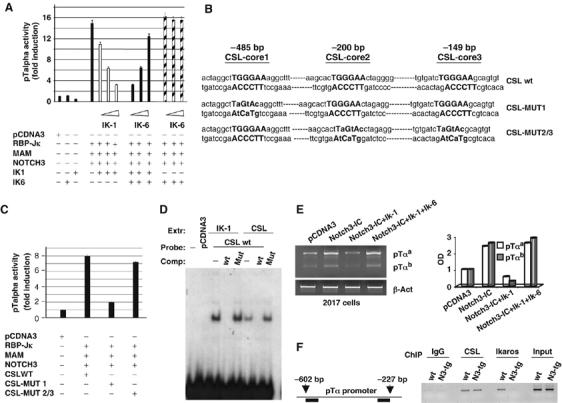
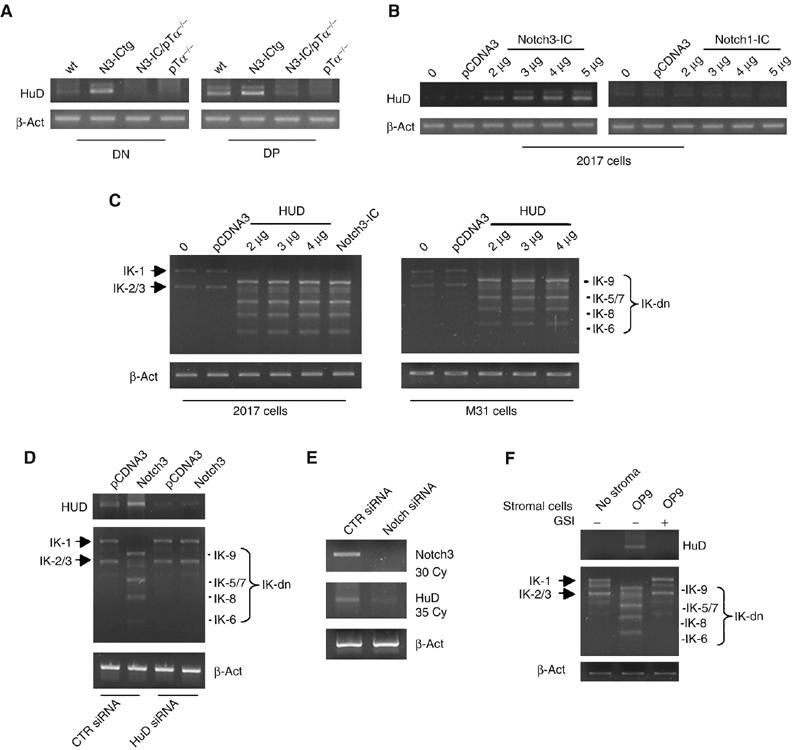
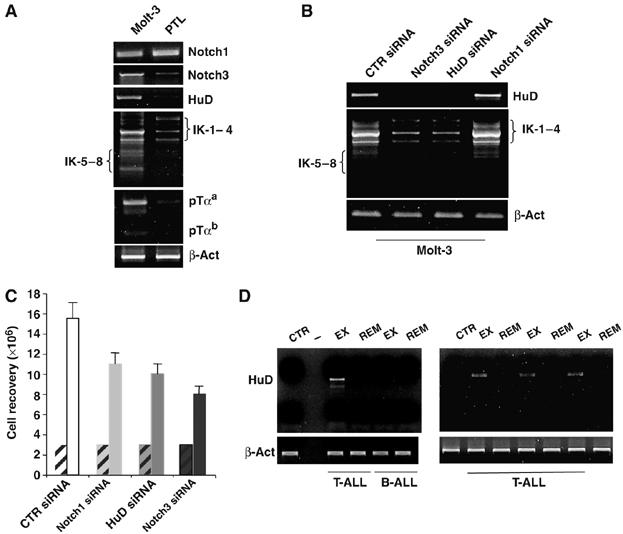
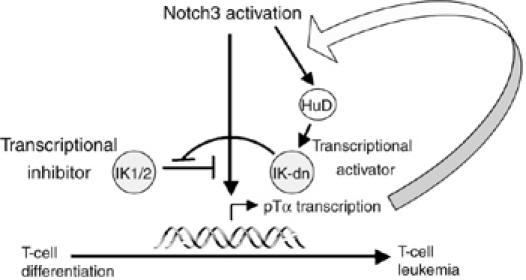
Constitutive activation of the transmembrane receptor, Notch3, and loss of function of the hematopoietic transcription repressor, Ikaros (IK), play direct roles in T-cell differentiation and leukemogenesis that are dependent on pre-T-cell receptor (pre-TCR) signaling. We demonstrate the occurrence of crosstalk between Notch3 and IK that results in transcriptional regulation of the gene encoding the pTalpha chain of the pre-TCR. We also show that, in the presence of the pre-TCR, constitutive activation of Notch3 in thymocytes causes increased expression of dominantnegative non-DNA-binding IK isoforms, which are able to restrain the IK inhibition of Notch3's transcriptional activation of pTalpha. This effect appears to be mediated by Notch3's pre-TCR-dependent upregulation of the RNA-binding protein, HuD. Notch3 signaling thus appears to play a critical role in the diminished IK activity described in several lymphoid leukemias. By exerting transcription-activating and transcription-repressing effects on the pTalpha promoter, Notch3 and IK cooperate in the fine-tuning of pre-TCR expression and function, which has important implications for the regulation of thymocyte differentiation and proliferation.


Figures

Figure 1
Figure 1
Alternatively spliced IK isoforms are overexpressed in premalignant thymocytes from Notch3-IC transgenic (N3-ICtg) mice. (A) CD4+ and/or CD8+ subset distributions (documented by two-color FCA) of thymocytes from 2-week-old wt and N3-ICtg mice. The number in each quadrant indicates the percentage of total cells represented by the corresponding subset. (B) IK isoform expression profiles assessed by RT–PCR (upper panel) and Western blot (lower panel) analysis of whole thymocyte lysates from two wt and two N3-ICtg mice. IK-1 and IK2/3: DNA-binding IK isoforms; IK-dn: dominant-negative IK spliced variants incapable of DNA binding. PCR products were analyzed by Southern blot using IK-6 cDNA as probe to detect the specific sequences. mRNA expression was monitored along the exponential phase of amplification and normalized to β-actin (β-act). In Western blot assay, results were normalized to β-tubulin (β-tub). The data are representative of three similar experiments.
Figure 2
Figure 2
IK isoform expression patterns are altered in T lymphoma cells from Notch3-IC transgenic (N3-ICtg) mice. (A) Two-color FCA analysis of CD4 versus CD8 expression in freshly isolated thymocytes (THY) (upper panels) and lymph node cells (LN) (lower panels) from 5-week-old mice: two wild-type (wt1 and wt2) and two N3-ICtg (N3-ICtg3 and N3-ICtg4). The number in each quadrant indicates the percentage of total cells represented by the corresponding subset. (B) Immunoblots of whole-cell extracts from the cells shown in panel A. IK1 and IK2/3: DNA-binding IK isoforms; IK-dn: dominant-negative IK isoforms incapable of DNA binding.
Figure 3
Figure 3
IK isoform expression patterns in thymocytes depend on pTa expression. (A) RT–PCR analysis of IK isoform expression was performed on RNA from sorted CD4-CD8 DN and CD4+CD8+ DP thymocytes from wild-type (wt), Notch3-IC transgenic (N3-ICtg), Notch3-IC/pTα−/− and pTα−/− mice. (B) IK immunoblot of whole-cell lysates of unfractionated thymocytes from one wt mouse and two mice of each of the three mutant genotypes listed above. IK1 and IK2/3: DNA-binding IK isoforms; IK-dn: dominant-negative IK isoforms incapable of DNA binding; IK ex 7: IK exon 7. Results were normalized to β-tubulin (β-tub).
Figure 4
Figure 4
Notch3 regulates alternative splicing of IK (IK) in vitro. DN1 and DN3 thymocytes (represented respectively by the M31 and 2017 cell lines) were transfected with increasing amounts of Notch3 (right panels) or Notch1 (left panels), and IK mRNA and protein expression was assessed by RT–PCR (A) and Western blotting (B). In the upper panels (A), Hes-1 (30 cycles for Notch1 and 35 cycles for Notch3) and Deltex RNA expressions were used as control of correct function of Notch1-IC and Notch3-IC constructs. The middle panel (A) shows the inability of Notch1-IC to increase the constitutive expression of Notch3 by 2017 cells at any cycles considered. IK1 and IK2/3: DNA-binding IK isoforms; IK-dn: dominant-negative IK isoforms incapable of DNA binding. β-Actin (β-act) and β-tubulin (β-tub) are shown as controls of equivalent loading of each sample.
Figure 5
Figure 5
Transcriptional activation of the pTα promoter by Notch3 is differentially regulated by IK isoforms. (A) HEK 293 cells were transfected with a luciferase reporter construct containing the pTα promoter together with Notch3, RBP-Jκ, and Mastermind (MAM). The pTα promoter is activated by the Notch3 transcription activator complex (Notch3+RBP-Jκ+MAM). Increasing amounts of IK-1 alone (200–800 ng) dose dependently repressed Notch3-driven activation of the pTα promoter, but the non-DNA-binding IK6-dn isoform alone (200–800 ng) had no impact. When IK-1 and IK-6 were cotransfected, increasing amounts of IK-6 progressively diminished the transcription repression induced by fixed amount of IK-1. DNA contents in the different transfection assays were normalized with empty vector (pcDNA3). The data shown were collected from three independent experiments; vertical bars indicate standard deviation. (B) Mutational analysis of the TGGGAA sequence in the pTα promoter. Wild-type and mutated sequences from the entire promoter are shown in boldface type and the cloned CSL wt sequence and mutant constructs, CSL-MUT1 and CSL-MUT2/3, are shown. (C) Luciferase activity of wild-type and mutant pTα promoter constructs. pCDNA3: empty vector. The histograms represent mean results of three independent transfection experiments. Vertical bars indicate the range of standard errors. (D) EMSA: nuclear extracts derived from COS cells transfected with either IK-1 (IK1) or CSL (CSL) expression vectors were probed with an oligo containing the wild-type CSL-core1 consensus (TGGGAA) (CSL-wt), as indicated in (B). For competition (comp), 100-fold molar excess of cold CSL-wt or CSL-MUT 1 was used. (E) RT–PCR expression analysis of pTαa and pTαb isoform mRNAs in 2017 cells. The cells were transiently transfected with Notch3-IC alone to induce increased pTα expression or together with Ik-1 or Ik-1+Ik-6 to demonstrate that Notch3-dependent induction is repressed by Ik-1 and derepressed by Ik-6. pTα mRNA levels were normalized to β-actin (β-act) (left panel) and optical densities relatively to empty vector-transfected cells (pCDNA3) are shown (right panel). (F) Schematic representation of pTα promoter region, assessed by ChIP is indicated (left panel). Primary thymocytes derived from wt and Notch3-IC transgenic mice (N3-tg) were processed for chromatin preparation and then subjected to immunoprecipitation with antibodies against RBP-Jk (CSL), IK or IgG as control. Immunoprecipitated DNA was analyzed by PCR with pTα promoter specific primers (right panel). The results are representative of three similar experiments.
Figure 6
Figure 6
Notch3-induced skewing of Ikaros (IK) isoform profiles is mediated by Notch3-dependent upregulation of the RNA-binding protein, HuD. HuD expression was assessed in vivo by semiquantitative RT–PCR analysis of RNA in (A) sorted CD4CD8 DN and CD4+CD8+ DP thymocytes from wt, N3-ICtg, N3-ICtg /pTα−/− and pTα−/− mice and (B) in vitro in 2017 cells transfected with increasing amounts of Notch3 (left panel) or Notch1 (right panel). (C) RT–PCR detected expression of alternatively spliced IK isoforms in 2017 and M31 cells transfected directly with HuD. (0=non-transfected cells; pCDNA3=empty vector-transfected cells.) (D) HuD siRNA assay showing that knockdown of endogenous HuD prevents the Notch3-induced modulation of IK-dn isoforms. HuD and IK mRNA expression profile as assessed by RT–PCR in 2017 cell line, transfected with pCDNA3 or Notch3 expression vectors, after HuD or scrambled (CTR) siRNA is shown. (E) siRNA of Notch3 is able to inhibit the constitutive expression of HuD in 2017 cells. RT–PCR for HuD and Notch3 mRNAs in 2017 cell line, after HuD or scrambled (CTR) siRNA is shown. (F) Coculture experiment of 2017 cells on OP9 stromal cells. RT–PCR for HuD (30 cycles) and IK mRNAs is shown. GSI: γ-secretase inhibitor I; IK-1 and IK-2/3: DNA-binding IK isoforms; IK-dn: dominant-negative IK isoforms incapable of DNA binding. mRNA expression was monitored along the exponential phase of amplification and normalized to β-actin (β-act).
Figure 7
Figure 7
The RNA-binding protein HuD is expressed in human T-ALL and regulates IK isoform profile. (A) RT–PCR expression analysis of human Notch1, Notch3, HuD, IK and pTα mRNAs in Molt-3 cell line and peripheral T lymphocytes from one healthy donor (PTL) used as control. Results were normalized to β-actin (β-act). (B) siRNA assay showing that HuD and Notch3, but not Notch1, are able to regulate IK mRNA expression profile in Molt-3 cells, as assessed by RT–PCR; CTR siRNA: scrambled siRNA. (C) Inhibition of proliferation of Molt-3 cells. Recovery of Molt-3 cells after Notch3, HuD, Notch1 or scrambled siRNA transfection, compared to the cell number at the starting point (hatched bars). The data shown represent the average of three independent experiments; vertical bars indicate standard deviation. (D) HuD expression was assessed by semiquantitative RT–PCR analysis of RNA in bone marrow samples from four different primary human T-ALLs and one primary B-ALL at different stages of disease (exordium, EX; and remission, REM) and one control patient (CTR). Results were normalized to β-actin (β-act).
Figure 8
Figure 8
Crosstalk among Notch3, IK and pre-TCR in the regulation of T cell development and lymphomagenesis. Overexpression of HuD by thymocytes is triggered in a pre-TCR-dependent manner by the activation of Notch3 signaling. As a result of its modulating effects on the splicing and/or stability of IK mRNA, HuD promotes the preferential expression of IK-dn isoforms, which diminish IK-induced transcriptional repression and further enhance the upregulation of pTα gene expression induced directly by the Notch3–CSL transcription activator complex.

References

    1. Akamatsu W, Fujihara H, Mitsuhashi T, Yano M, Shibata S, Hayakawa Y, Okano HJ, Sakakibara S, Takano H, Takano T, Takahashi T, Noda T, Okano H (2005) The RNA-binding protein HuD regulates neuronal cell identity and maturation. Proc Natl Acad Sci USA 102: 4625–4630 - PMC - PubMed
    1. Allman D, Karnell FG, Punt JA, Bakkour S, Xu L, Myung P, Koretzky GA, Pui JC, Aster JC, Pear WS (2001) Separation of Notch1 promoted lineage commitment and expansion/transformation in developing T cells. J Exp Med 194: 99–106 - PMC - PubMed
    1. Bellavia D, Campese AF, Alesse E, Vacca A, Felli MP, Balestri A, Stoppacciaro A, Tiveron C, Tatangelo L, Giovarelli M, Gaetano C, Ruco L, Hoffman ES, Hayday AC, Lendahl U, Frati L, Gulino A, Screpanti I (2000) Constitutive activation of NF-kappaB and T-cell leukemia/lymphoma in Notch3 transgenic mice. EMBO J 19: 3337–3348 - PMC - PubMed
    1. Bellavia D, Campese AF, Checquolo S, Balestri A, Biondi A, Cazzaniga G, Lendahl U, Fehling HJ, Hayday AC, Frati L, von Boehmer H, Gulino A, Screpanti I (2002) Combined expression of pTalpha and Notch3 in T cell leukemia identifies the requirement of preTCR for leukemogenesis. Proc Natl Acad Sci USA 99: 3788–3793 - PMC - PubMed
    1. Beverly LJ, Capobianco AJ (2003) Perturbation of Ikaros isoform selection by MLV integration is a cooperative event in Notch(IC)-induced T cell leukemogenesis. Cancer Cell 3: 551–564 - PubMed

Publication types

MeSH terms