Comparative Study
. 2007 Mar 21;26(6):1475-86.
doi: 10.1038/sj.emboj.7601609. Epub 2007 Mar 1.

The novel cargo Alcadein induces vesicle association of kinesin-1 motor components and activates axonal transport

Affiliations
Comparative Study

The novel cargo Alcadein induces vesicle association of kinesin-1 motor components and activates axonal transport

Yoichi Araki et al. EMBO J. .

Abstract

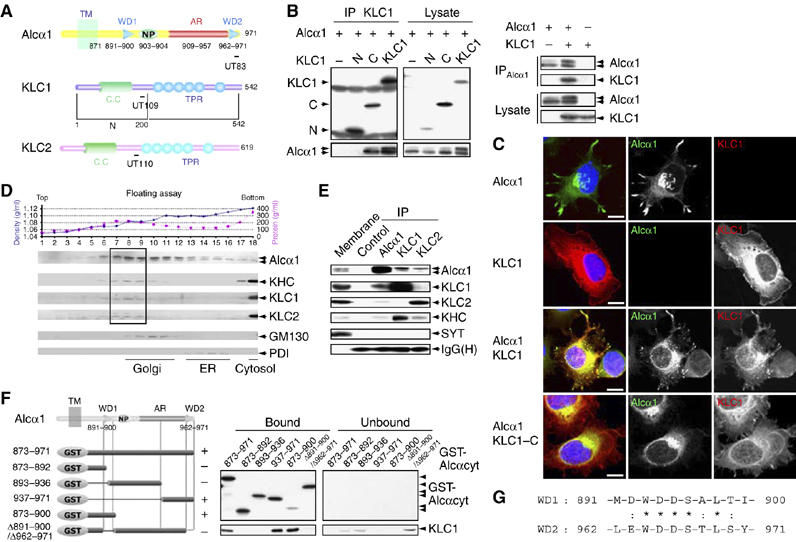
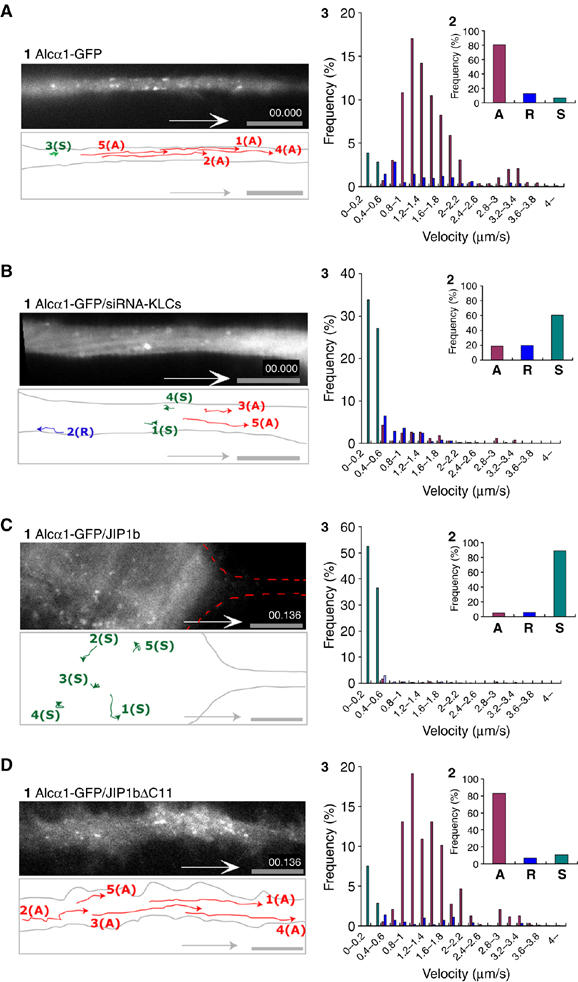
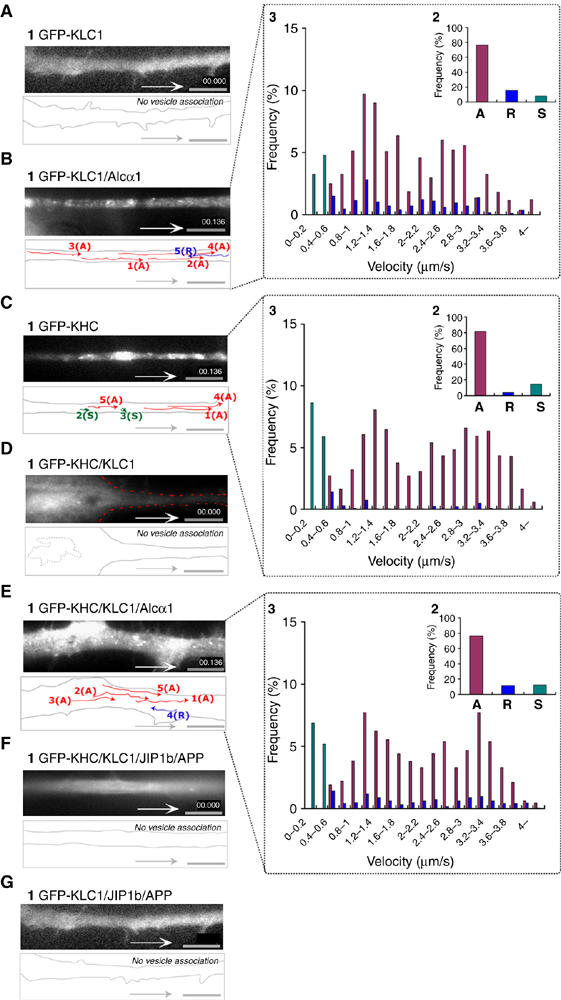
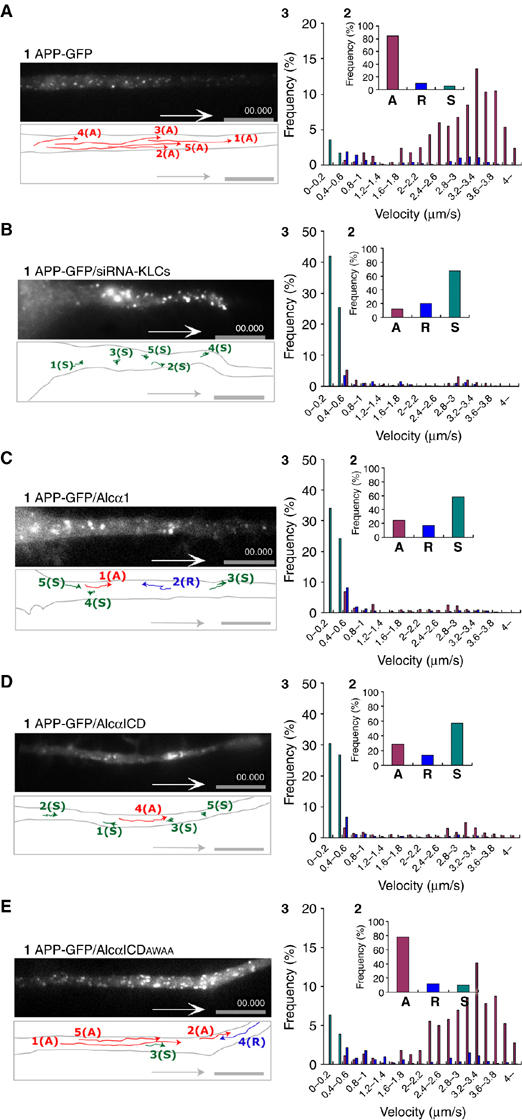
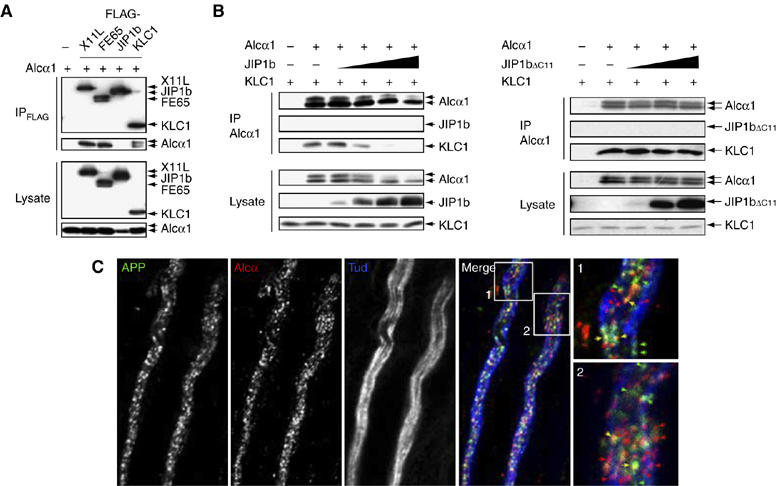
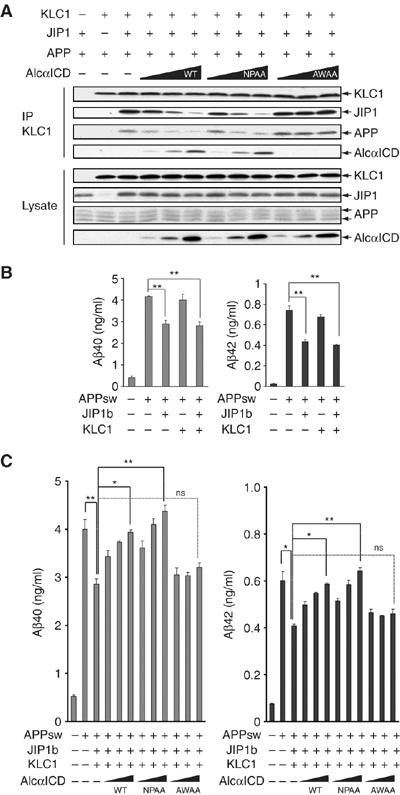
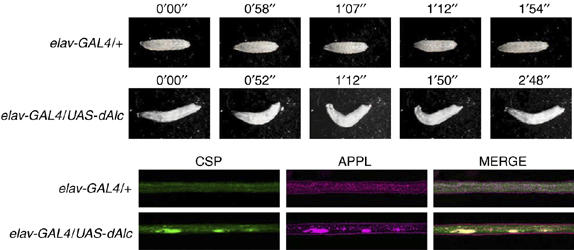
Alcadeinalpha (Alcalpha) is an evolutionarily conserved type I membrane protein expressed in neurons. We show here that Alcalpha strongly associates with kinesin light chain (K(D) approximately 4-8x10(-9) M) through a novel tryptophan- and aspartic acid-containing sequence. Alcalpha can induce kinesin-1 association with vesicles and functions as a novel cargo in axonal anterograde transport. JNK-interacting protein 1 (JIP1), an adaptor protein for kinesin-1, perturbs the transport of Alcalpha, and the kinesin-1 motor complex dissociates from Alcalpha-containing vesicles in a JIP1 concentration-dependent manner. Alcalpha-containing vesicles were transported with a velocity different from that of amyloid beta-protein precursor (APP)-containing vesicles, which are transported by the same kinesin-1 motor. Alcalpha- and APP-containing vesicles comprised mostly separate populations in axons in vivo. Interactions of Alcalpha with kinesin-1 blocked transport of APP-containing vesicles and increased beta-amyloid generation. Inappropriate interactions of Alc- and APP-containing vesicles with kinesin-1 may promote aberrant APP metabolism in Alzheimer's disease.


Figures

Figure 1
Figure 1
Interaction of Alcα with KLC and determination of the KLC-binding site on Alcα. (A) Structure of the cytoplasmic domains of Alcα, KLC1, KLC1-N (N), KLC1-C (C), and KLC2. Numbers represent amino-acid sequences. TM, transmembrane domain; WD, tryptophan- and aspartic acid-containing sequence (see ‘G'); NP, Asn-Pro motif; AR, acidic region; CC, coiled-coil domain; TPR, tetratrico-peptide repeat. Epitopes for the UT83, UT109, and UT110 antibodies are indicated with bars. (B) (Left panel) Co-immunoprecipitation of Alcα1 with amino-terminal FLAG-tagged KLC1 and deletion constructs. HEK293 cells were transiently cotransfected with pcDNA3-hAlcα1 and pcDNA3.1-FLAG-mKLC1 (KLC1), pcDNA3.1-FLAG-mKLC1-N (N), pcDNA3.1-FLAG-mKLC1-C (C), or pcDNA3.1-FLAG (−). Cell lysates were immunoprecipitated with an anti-FLAG (M2) antibody. The immunoprecipitates (IP) and lysate were analyzed by Western blotting with M2 and UT83. (Right panel) Co-immunoprecipitation of KLC1 with Alcα1. HEK293 cells were transiently transfected with pcDNA3-hAlcα1 and pcDNA3.1-mKLC1. Transfection with plasmid (+) or vector alone (−) is indicated. Cell lysates were immunoprecipitated with an anti-Alcα (UT83) antibody. The immunoprecipitates (IP) and lysate were analyzed by Western blotting with UT83 and UT109. (C) Localization of Alcα1 and KLC1. CAD cells were transiently cotransfected with the indicated combinations of pcDNA3-hAlcα1, pcDNA3.1-FLAG-mKLC1, and pcDNA3.1-FLAG-mKLC1-C for 48 h and differentiated for 24 h by depleting serum. Alcα1 and FLAG-tagged KLC1 were immunostained with UT83 (green) and M2 (red) antibodies, respectively. Nuclei were stained using 4′,6′-diamidino-2-phenylindole dihydrochloride (DAPI, blue). Merged signals are shown at the left. Scale bar, 5 μm. (D) Membrane fractionation of brain tissues. The post-nuclear supernatant of adult mouse brains was fractionated by 0–28% iodixanol density gradient centrifugation (Araki et al, 2003). (Upper panel) The density (blue circles) and protein concentration (pink squares) are indicated. Fraction numbers are indicated along the abscissa. (Lower panel) The fractions were analyzed by Western blotting with antibodies to Alcα (UT83), KHC (H2), KLC1 (UT109), KLC2 (UT110), and the Golgi-resident GM130 (clone no. 35) and the ER-resident PDI (1D3). The dotted square indicates the fractions containing the highest levels of Alcα, KHC, KLC1, and KLC2. (E) Co-immunoprecipitation of Alcα with KLC. The mouse brain membrane fraction (500 μg protein) was solubilized, and Alcα1, KLC1, and KLC2 were immunoprecipitated with the UT83, UT109, and UT110 antibodies, respectively, or a control non-immune antibody. The membrane fraction (Membrane, 10 μg protein) and immunoprecipitates (IP) were analyzed by Western blotting with antibodies specific for Alcα (UT83), KLC1 (UT109), KLC2 (UT110), KHC (H2), and SYT (clone no. 41). IgG(H) indicates the IgG heavy chain (rabbit). (F) Determination of the KLC-binding site on Alcα. (Left) Various GST-fusion proteins of the Alcα cytoplasmic domain (shown schematically, numbers are amino-acid residues) were incubated with HEK293 cell lysates expressing FLAG-KLC1. FLAG-KLC1 bound to GST-Alcαcyt was recovered using glutathione beads. (Right) The bound and unbound FLAG-KLC1 were analyzed by Western blotting with the M2 antibody. GST-Alcα1 protein constructs were detected by Western blotting with an anti-GST antibody. In the left panel, ‘+' indicates positive binding and ‘−' indicates negative binding. (G) Amino-acid sequences of WD1 and WD2 of Alcα1. Numbers indicate amino-acid residues. Identical (*) and similar (:) amino-acid residues are indicated.
Figure 2
Figure 2
Kinesin-1-dependent anterograde transport of Alcα cargo in living neuronal cells. (A, B) Anterograde movement of Alcα1 cargo vesicles in an axon. (A) Differentiating CAD cells expressing Alcα1-GFP were observed using TIRF microscopy (panel 1). (B) Kinesin-1-dependent transport of Alcα1 cargo in neuronal cells. Differentiating CAD cells expressing Alcα1-GFP in which KLC1 and KLC2 expression has been knocked down using siRNA were observed using TIRF microscopy (panel 1). Vesicle movements in the dotted square were tracked with time-lapse imaging and are indicated with colored lines and numbers (see Supplementary Movie 1, parts 1 and 2 in Sup_2.mov). Scale bar, 5 μm. (C, D) Inhibition of anterograde transport of Alcα1 cargo by expression of JIP1b. Differentiating CAD cells expressing Alcα1-GFP in the presence of JIP1b (C) and JIP1bΔC11 (D) were observed using TIRF microscopy (panel 1). Vesicle movements in the dotted square were tracked with time-lapse imaging and are indicated with colored lines and numbers (see Supplementary Movie 1, parts 3 and 4 in Sup_2.mov). Scale bar, 5 μm. (A–D) Red lines indicate tracks of anterograde transport, blue lines indicate tracks of retrograde transport, and green spots indicate stationary vesicles moving at less than 0.4 μm/s (panel 1). Alcα1 and APP cargo vesicles transported anterogradely (‘A') and retrogradely (‘R'), and stationary vesicles (‘S') in 25 cells were counted with Metamorph software and the fraction of the total number of vesicles (%) is indicated (panel 2). Distribution (%) of anterograde (red) and retrograde (blue) transport velocity of Alcα1 cargo and of stationary vesicles (green) is shown (panel 3).
Figure 3
Figure 3
Vesicle association of kinesin-1 components mediated by Alcα1 cargo in axonal transport. (A, B) Vesicule association of KLC1 induced by Alcα1. Differentiating CAD cells expressing GFP-KLC1 with (B) or without (A) Alcα1 were observed with TIRF microscopy. (C, D) Inhibition of vesicular association of KHC by KLC. Differentiating CAD cells expressing GFP-KHC with (D) or without (C) KLC1 were observed with TIRF microscopy. (E, F) Vesicular association of KHC mediated by Alcα1 (E) but not by JIP1b and APP (F) in the presence of KLC1. (G) KLC is not vesicle associated in the presence of JIP1b and APP. (A–G) Vesicle movements were tracked with time-lapse imaging and are indicated with colored lines and numbers (panel 1; see Supplementary Movie 4, in Sup_5.mov). Red lines indicate tracks of anterograde vesicle transport, blue lines indicate tracks of retrograde vesicle transport, and green spots indicate stationary vesicles moving at less than 0.4 μm/s. Scale bar, 5 μm. Vesicles containing KLC or KHC transported anterogradely (‘A') and retrogradely (‘R'), and stationary vesicles (‘S') in 25 cells were counted with Metamorph software and the fraction of the total number of vesicles (%) is indicated (panel 2 of B, C, E). Distribution (%) of anterograde (red) and retrograde (blue) transport velocity of Alcα1 cargo, as well as stationary vesicles (green), is indicated (panel 3 of B, C, E).
Figure 4
Figure 4
Transport of APP-containing vesicles and suppression of transport by expression of Alcα1 and AlcαICD in living neuronal cells. (A) Anterograde transport of APP-containing vesicles in an axon. Differentiating CAD cells expressing APP-GFP were observed using TIRF microscopy (panel 1). (B) Kinesin-1-dependent transport of APP-containing vesicles in neuronal cells. Differentiating CAD cells expressing APP-GFP and in which KLC1 and KLC2 expression has been knocked down using siRNA were observed using TIRF microscopy (panel 1). (C–E) Anterograde transport of APP-containing vesicles in differentiating CAD cells expressing APP-GFP in the presence or absence of Alcα1 or AlcαICD. Axonal transport of APP-GFP in the presence of Alcα1 (C), AlcαICD (D), or AlcαICD(AWAA) (E) was observed with TIRF microscopy. Vesicle movements in the dotted square were tracked with time-lapse imaging and are indicated with colored lines and numbers (see Supplementary Movie 5, in Sup_6.mov). Red lines indicate vesicles transported anterogradely (‘A'), blue lines indicate vesicles transported retrogradely (‘R'), and green spots indicate stationary vesicles moving at less than 0.5 μm/s (‘S'). Scale bar, 5 μm. The vesicles in 25 cells were counted with Metamorph software and the fraction of the total number of vesicles (%) is indicated (panel 2). Distribution (%) of anterograde (red) and retrograde (blue) transport velocity of APP-containing vesicles and of stationary vesicles (green) is indicated (panel 3).
Figure 5
Figure 5
Separate transport of APP- and Alcα-containing vesicles by kinesin-1. (A) Interaction of Alcα1 with adaptor proteins. HEK293 cells were transiently transfected with pcDNA3-hAlcα1 (+) in the presence of pcDNA3-FLAG-hX11L, pcDNA3-N-FLAG-FE65, pcDNA3-FLAG-JIP1b, pcDNA3.1-FLAG-mKLC1, or vector alone (−). Cells were lysed and immunoprecipitated with the anti-FLAG M2 antibody. Immunoprecipitates (IP) and cell lysates (Lysate) were analyzed by Western blotting with the M2 and anti-Alcα UT83 antibodies. (B) Effect of wild-type and mutant JIP1b on the Alcα1-KLC1 interaction. (Left) HEK293 cells were transiently cotransfected with pcDNA3.1-mKLC1 (0.5 μg), pcDNA3-hAlcα1 (0.5 μg), and 0, 0.05, 0.2, 0.7, or 2.2 μg pcDNA3-JIP1b. Cell lysates were immunoprecipitated with an anti-Alcα (UT83) antibody and immunoprecipitates (IP) and cell lysates (Lysate, 10 μg protein) were analyzed by Western blotting with the UT83, UT72, and UT109 antibodies. (Right) Cells were similarly cotransfected using 0, 0.2, 0.7, or 2.2 μg pcDNA3.1-JIP1bΔC11. The UT83 immunoprecipitate (IP) and cell lysate (Lysate, 10 μg protein) were analyzed as described above. Transfection with 0.5 μg plasmid (+) or vector alone (−) is indicated. (C) APP- and Alcα-containing vesicles in adult mouse sciatic nerve. Isolated axons of sciatic nerves were immunostained with anti-APP (αAPP/C, green), anti-Alcα (co190, red), and anti-neuronal Class III β-tubulin (TUJ1, blue; showing axons) antibodies. Signals are merged and magnified in the lower panels. Yellow arrows indicate vesicles containing both APP and Alcα. Scale bar, 5 μm.
Figure 6
Figure 6
Increased Aβ production by suppressed transport of APP-containing vesicles. (A) AlcαICD expression interfers with JIP1b-mediated association of APP and KLC1. HEK293 cells were transiently cotransfected with pcDNA3.1-mKLC1, pcDNA3-JIP1b, pcDNA3-hAPP695, and 0, 0.25, 0.5, or 1.0 μg pcDNA3-hAlcαICD (WT), pcDNA3-hAlcαICD/NPAA (NPAA), or pcDNA3-hAlcαICD/AWAA (AWAA). Transfection with 0.5 μg plasmid (+) and vector alone (−) is indicated. Cell lysates were subjected to immunoprecipitation with an anti-KLC1 antibody (UT109), and the immunoprecipitates (IP) and cell lysates (Lysate, 10 μg protein) were analyzed by Western blotting with UT109, anti-JIP1b (UT72), anti-APP (αAPP/c; Sigma), and anti-Alcα (UT83) antibodies. (B) Aβ secretion from APPsw mutant HEK293 cells expressing JIP1b or KLC1 alone. Aβ secretion from HEK293 cells used in (A) in which transfection of pcDNA3-hAPP695sw was substituted for pcDNA3-hAPP695. At 48 h after transfection, the culture medium was collected and analyzed for Aβ40 (left) and Aβ42 (right) levels using a sandwich ELISA (Araki et al, 2003). Concentrations of Aβ40 and Aβ42 are presented as means±s.e. (n=3). (C) HEK293 cells transfected with pcDNA3-hAPP695sw and the indicated plasmids, as described in (A), were used for Aβ assay. Aβ40 (left) and Aβ42 (right) were quantified as described above. The data were analyzed by one-way analysis of variance followed by Tukey's test (*P< 0.05; **P<0.01; ns, not significant).
Figure 7
Figure 7
Impairment of motor neuron function and axonal transport by dAlc expression in Drosophila. (Upper panels) Larval movement. Movement of elav-GAL4/+ (upper) and elav-GAL4/UAS-dAlc (lower) third instar larvae. Numbers indicate time. See Supplementary Movie 7, in Sup_8.mov. (Lower panels) Aggregation of APPL-containing vesicles by dAlc expression. Immunostaining of axons from elav-GAL4/+ (upper) and elav-GAL4/UAS-dAlc (lower) third instar larvae. Larval segmental nerve axons were stained with antibodies against a synaptic vesicle marker protein (CSP) and APPL. Merged signals are shown in the panels on the right.

References

    1. Araki Y, Miyagi N, Kato N, Yoshida T, Wada S, Nishimura M, Komano H, Yamamoto T, De Strooper B, Yamamoto K, Suzuki T (2004) Coordinated metabolism of Alcadein and amyloid β-protein precursor regulates FE65-dependent gene transactivation. J Biol Chem 279: 24343–24354 - PubMed
    1. Araki Y, Tomita S, Yamaguchi H, Miyagi N, Sumioka A, Kirino Y, Suzuki T (2003) Novel cadherin-related membrane proteins, Alcadeins, enhance the X11-like protein-mediated stabilization of amyloid β-protein precursor metabolism. J Biol Chem 278: 49448–49458 - PubMed
    1. Brand AH, Perrimon N (1993) Targeted gene expression as a means of altering cell fates and generating dominant phenotypes. Development 118: 401–415 - PubMed
    1. Chalvet F, Samson M-L (2002) Characterization of fly strains permitting GAL4-directed expression of found in neuron. Genesis 34: 71–73 - PubMed
    1. Citron M, Oltesdorf T, Haass C, McConlogue L, Hung AY, Seubert P, Vigo-Pelfrey C, Lieberburg I, Selkoe DJ (1992) Mutation of the β-amyloid precursor protein in familial Alzheimer's disease increases β-protein production. Nature 360: 672–674 - PubMed

Publication types

MeSH terms