Comparative Study
. 2007 Mar 21;26(6):1499-510.
doi: 10.1038/sj.emboj.7601606. Epub 2007 Mar 1.

MT1-MMP proinvasive activity is regulated by a novel Rab8-dependent exocytic pathway

Affiliations
Comparative Study

MT1-MMP proinvasive activity is regulated by a novel Rab8-dependent exocytic pathway

Jose J Bravo-Cordero et al. EMBO J. .

Abstract

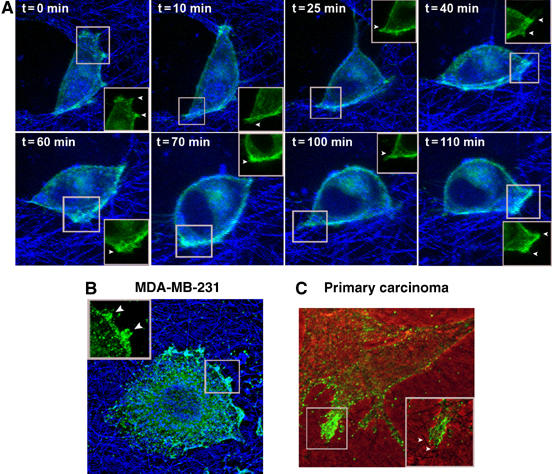
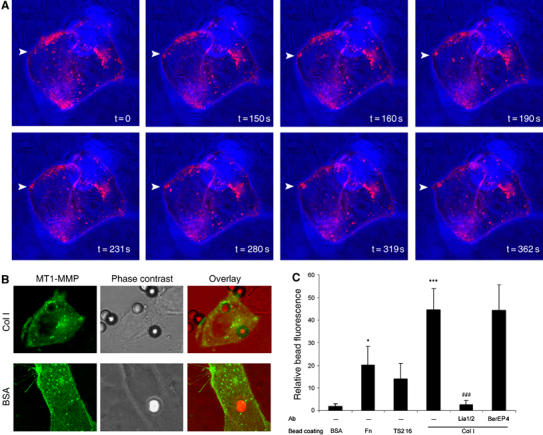
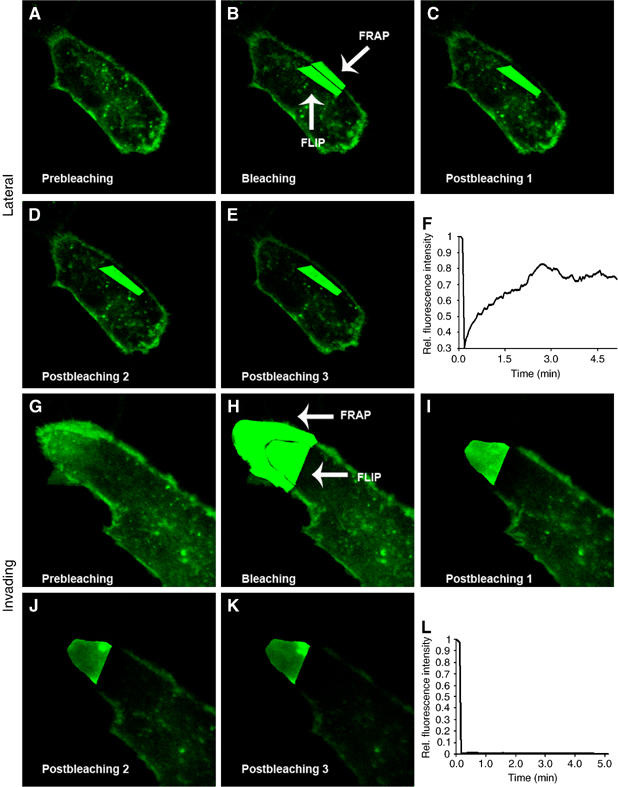
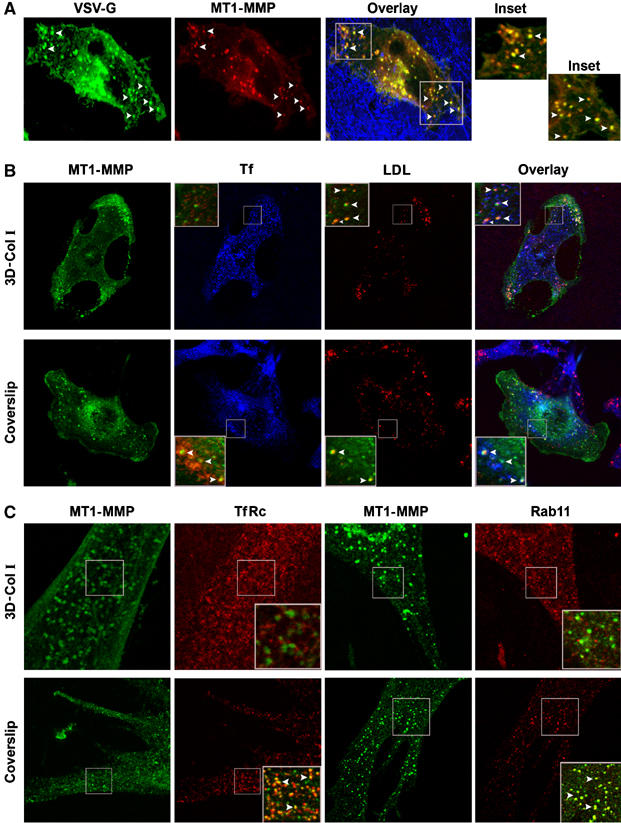
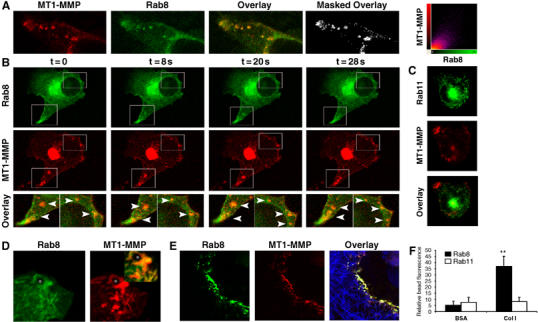
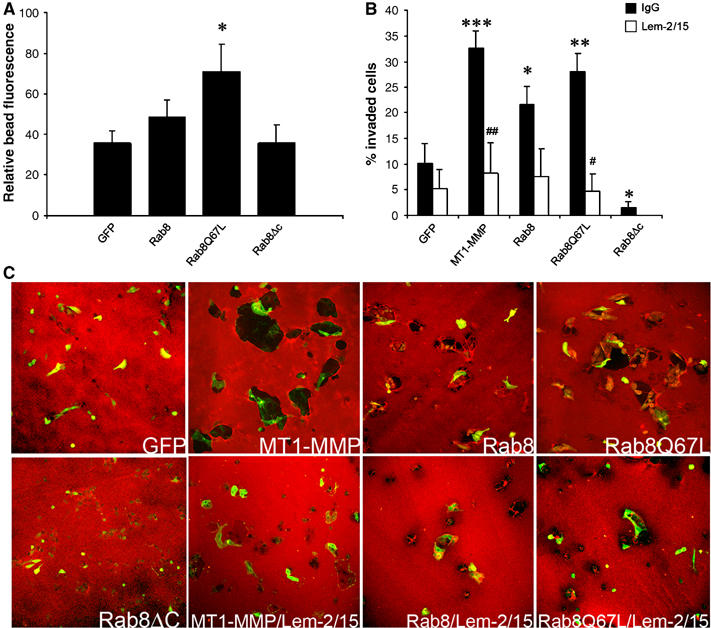
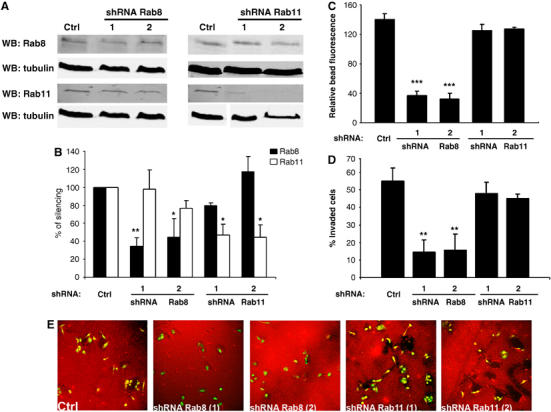
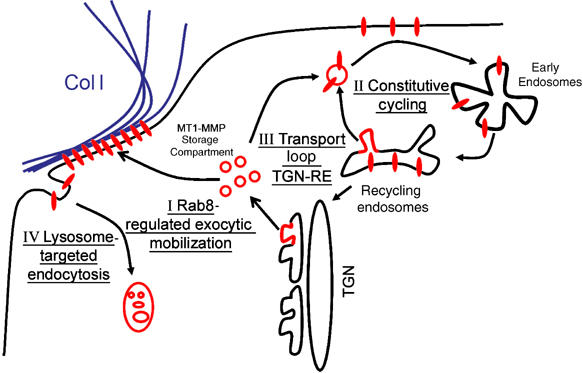
MT1-matrix metalloproteinase (MT1-MMP) is one of the most critical factors in the invasion machinery of tumor cells. Subcellular localization to invasive structures is key for MT1-MMP proinvasive activity. However, the mechanism driving this polarized distribution remains obscure. We now report that polarized exocytosis of MT1-MMP occurs during MDA-MB-231 adenocarcinoma cell migration into collagen type I three-dimensional matrices. Polarized trafficking of MT1-MMP is triggered by beta1 integrin-mediated adhesion to collagen, and is required for protease localization at invasive structures. Localization of MT1-MMP within VSV-G/Rab8-positive vesicles, but not in Rab11/Tf/TfRc-positive compartment in invasive cells, suggests the involvement of the exocytic traffic pathway. Furthermore, constitutively active Rab8 mutants induce MT1-MMP exocytic traffic, collagen degradation and invasion, whereas Rab8- but not Rab11-knockdown inhibited these processes. Altogether, these data reveal a novel pathway of MT1-MMP redistribution to invasive structures, exocytic vesicle trafficking, which is crucial for its role in tumor cell invasiveness. Mechanistically, MT1-MMP delivery to invasive structures, and therefore its proinvasive activity, is regulated by Rab8 GTPase.


Figures

Figure 1
Figure 1
MT1-MMP accumulates at the sites of active collagen degradation during invasion of 3D-Col I matrices. (A) Live cell confocal imaging of MT1-MMP-GFP expressed in MDA-MB-231 cells embedded into 3D-Col I. Overlay of MT1-MMP-GFP fluorescence (green) and collagen fiber reflection (blue) images obtained at the indicated time points during the course of a time-lapse experiment is shown (see Supplementary Video 1). (B, C) Localization of endogenous MT1-MMP revealed by immunofluorescence staining with Lem-2/15 mAb of MDA-MB-231 cells and endometrial carcinoma primary cultured cells embedded into 3D-Col I. (B) Overlay of MT1-MMP staining (green) and collagen fiber reflection (blue) images is shown. (C) Overlay of phase contrast and fluorescence images. Insets show membrane sites engaging bundles of collagen fibers. GFP concentration at invasive structures is pointed by arrowheads.
Figure 2
Figure 2
MT1-MMP intracellular vesicle recruitment toward collagen contact sites at the PM of MDA-MB-231 cells. (A) Live cell imaging of MDA-MB-231 cells transfected with MT1-MMP-GFP and embedded into 3D-Col I. Overlay of fluorescence and phase-contrast images showing MT1-MMP-GFP localization (pink) and cell morphology/collagen fiber distribution respectively, acquired at different time points is shown (see Supplementary Video 2). Arrowheads point to a new contact established between the cell membrane and a meshwork of collagen fibers, where active vesicle recruitment is observed. (B) MDA-MB-231 cells expressing MT1-MMP-GFP (green), cultured on glass coverslips, were incubated with Col I- or BSA-coated beads for 1 h, fixed and imaged. Fluorescence image (showing GFP), phase-contrast image (showing cell morphology and bead localization) and their overlay are presented. (C) Beads coated with BSA, Fn, anti-β1 Ab (TS2/16) or Col I were allowed to interact for 1 h with MDA-MB-231 cells that had been previously treated with or without not with a blocking anti-β1 (Lia1/2) or control (BerEP4) Abs. Cells were then fixed and imaged by confocal microscopy. Bars represent relative fluorescence intensity at the bead surrounding area normalized for background fluorescence calculated at 10–15 beads for each of the three independent experiments performed. The statistical significance of relative bead fluorescence comparing the different bead coatings and control (BSA) values (*) and antibody-treated compared to isotype control values (#) was evaluated using Student's t-test. (*P<0.05; ***/###P<0.001).
Figure 3
Figure 3
MT1-MMP FRAP/FLIP experiments reveal that intracellular vesicle traffic is responsible for the accumulation of MT1-MMP at the invasive PM. MT1-MMP-GFP expressing MDA-MB-231 cells embedded into 3D-Col I were subjected to FRAP-FLIP photobleaching experiments. Images showing prebleaching, bleaching and post-bleaching at the PM (FRAP region) during continuous photobleaching of the submembranous compartment (FLIP region) at the lateral (AE) and invading (GK) PM. Fluorescence recovery quantification at the FRAP region is calculated at the lateral (F) and invading (L) PM and represented in the graph.
Figure 4
Figure 4
MT1-MMP colocalization with markers of the biosynthetic/recycling and degradative routes. (A) MDA-MB-231 cells cotransfected with MT1-MMP-mRFP and VSV-G-YFP were embedded into 3D-Col I. Cells were incubated overnight at 40°C, then transferred to 20°C for 2 h and finally shifted to 32°C for 1 h. Cells were then fixed and imaged. Arrowheads point to vesicles positive for both VSV-G (green) and MT1-MMP (red). Overlay image shows colocalization (yellow) and fiber reflection (blue). (B) MDA-MB-231 cells transfected with MT1-MMP-GFP were either embedded into 3D-Col I (upper panel) or plated on coverslips (lower panel) and incubated with labelled Tf and LDL for 1 h at 37°C to allow their internalization. Images show localization of MT1-MMP-GFP (green), Tf (blue), LDL (red), and their overlay. (C) Primary lung adenocarcinoma cells were either embedded into 3D-Col I (upper panel) or plated on coverslips (lower panel) and immunostained with specific Abs for TfRc or Rab11 (red), and MT1-MMP (green), as indicated. Insets show superimposed fluorescence images pseudocolored in green/red; arrowheads point colocalization vesicles (shown in yellow).
Figure 5
Figure 5
Rab8 but not Rab11 codistributes with MT1-MMP during vesicle transport to the PM. MDA-MB-231 transfected with MT1-MMP-mRFP and Rab8-GFP were embedded into 3D-Col I and analyzed by confocal imaging. (A) MT1-MMP-mRFP fluorescence (red), Rab8-GFP (green) and the superimposed images where colocalization can be seen in yellow, as well as the image showing exclusively colocalizing pixels (white) are shown. 2D colocalization histogram corresponding to these images obtained using Imaris software (Bitplane AG, Zurich, Switzerland) is also shown. Live cell imaging of 3D-Col I invading MDA-MB-231 cells transfected with MT1-MMP-mRFP and either Rab8-GFP (B) or Rab-11-GFP (C). Images acquired at the indicated time points show Rab8 or Rab11 (green) and MT1-MMP (red) localization during the course of the experiment (see Supplementary Video 11). (D) MDA-MB-231 cells expressing MT1-MMP-mRFP (red) and Rab8-GFP (green), cultured on glass coverslips, were incubated with Col I-coated beads for 1 h, then fixed and imaged. Overlay of fluorescence images is presented in inset. Asterisk indicates bead localization. (E) Confocal images of MT1-MMP-mRFP (red) and Rab8-GFP (green) fluorescence and collagen fiber reflection (blue) shows colocalization of MT1-MMP and Rab8 attached to degraded collagen fibers. (F) Beads coated with BSA or Col I were allowed to interact with Rab8-GFP- or Rab11-GFP-expressing MDA-MB-231 cells. Bars represent relative fluorescence intensity at the bead surrounding area normalized to background fluorescence calculated at 10–15 beads for each of the three independent experiments performed.
Figure 6
Figure 6
Rab8 activation induces recruitment of MT1-MMP vesicles, MT1-MMP-dependent collagen degradation and invasion. (A) MDA-MB-231 cells were cotransfected with MT1-MMP-mRFP and either GFP, wtRab8-GFP, Rab8Q67L-GFP or Rab8ΔC-GFP, and, allowed to interact with Col I-coated beads for 1 h, then fixed and analyzed by confocal microscopy. Bars represent the percentage of MT1-MMP-mRFP fluorescence intensity around the bead calculated in 10–18 cells expressing the different GFP constructs from three independent experiments. (B) MDA-MB-231 cells were transfected with GFP, wtRab8-GFP, Rab8Q67L-GFP, Rab8ΔC-GFP or MT1-MMP-GFP. Cells were then allowed to migrate for 48 h on transwell filters coated with 3D-Col I to FCS containing media in the presence of isotype control IgG (solid bars), or function blocking anti-MT1-MMP Ab (Lem-2/15) (open bars). Bars represent the percentage of invaded GFP-expressing cells quantified in seven independent experiments by counting four different fields for each experiment. (C) MDA-MB-231 cells transfected with GFP, wtRab8-GFP, Rab8Q67L-GFP, Rab8ΔC-GFP or MT1-MMP-GFP were cultured on 2D-Col I layers for 48 h in the presence or absence of function blocking anti-MT1-MMP Ab (Lem-2/15), then fixed and labelled with anti-Col I antibody to evaluate degradation. Representative overlay images of Col I staining (red) and expression of the different constructs (green) is shown. The statistical significance comparing expression of different constructs to control (GFP) values (*) and antibody-treated compared to isotype control values (#) was evaluated using Student's t-test (*/#P<0.05; **/##P<0.01; ***/###P<0.001).
Figure 7
Figure 7
Rab8 but not Rab11 knockdown with shRNA decreases MT1-MMP vesicle recruitment, collagen degradation and invasion. MDA-MB-231 cells stably expressing PMCSV Pig (control), or PMCSV carrying Rab8shRNA sequences 1 and 2 or Rab11shRNA sequences 1 and 2. (A) The levels of Rab8 protein was assessed by Western blot analysis. Control tubulin blotting is also shown. (B) Quantification of Rab8 protein levels normalized using tubulin as a loading control is represented in the bar diagram. Endogenous vesicle recruitment (C), transwell invasion (D) and collagen degradation (E) were evaluated as described in Figure 6. (E) Representative images show Col I staining (red) and GFP expression from PMCSV vector (green). Asterisks indicate statistical significance comparing the expression of the different shRNAs to control (PMCSV Pig) values.
Figure 8
Figure 8
Model for MT1-MMP intracellular trafficking. The model depicts two main intracellular pathways (I) Rab8-regulated exocytic mobilization of MT1-MMP from a biosynthetic storage compartment induced by collagen engagement in invading cells (II) Constitutive cycling from recycling endosomes in a stationary cell involves MT1-MMP un-engaged in matrix degradation. Additional pathways could involve (III) transport loop between the biosynthetic storage and recycling compartments and (IV) endocytosis targeted to lysosome degradation of surface MT1-MMP involved in collagen degradative activity.

References

    1. Allinen M, Beroukhim R, Cai L, Brennan C, Lahti-Domenici J, Huang H, Porter D, Hu M, Chin L, Richardson A, Schnitt S, Sellers WR, Polyak K (2004) Molecular characterization of the tumor microenvironment in breast cancer. Cancer Cell 6: 17–32 - PubMed
    1. Ang AL, Folsch H, Koivisto UM, Pypaert M, Mellman I (2003) The Rab8 GTPase selectively regulates AP-1B-dependent basolateral transport in polarized Madin–Darby canine kidney cells. J Cell Biol 163: 339–350 - PMC - PubMed
    1. Ang AL, Taguchi T, Francis S, Folsch H, Murrells LJ, Pypaert M, Warren G, Mellman I (2004) Recycling endosomes can serve as intermediates during transport from the Golgi to the plasma membrane of MDCK cells. J Cell Biol 167: 531–543 - PMC - PubMed
    1. Bretscher MS, Aguado-Velasco C (1998) Membrane traffic during cell locomotion. Curr Opin Cell Biol 10: 537–541 - PubMed
    1. Chieregatti E, Meldolesi J (2005) Regulated exocytosis: new organelles for non-secretory purposes. Nat Rev Mol Cell Biol 6: 181–187 - PubMed

Publication types