

Hydration of POPC bilayers studied by 1H-PFG-MAS-NOESY and neutron diffraction
- PMID: 17333162
- PMCID: PMC3762691
- DOI: 10.1007/s00249-007-0142-6
Hydration of POPC bilayers studied by 1H-PFG-MAS-NOESY and neutron diffraction
Abstract
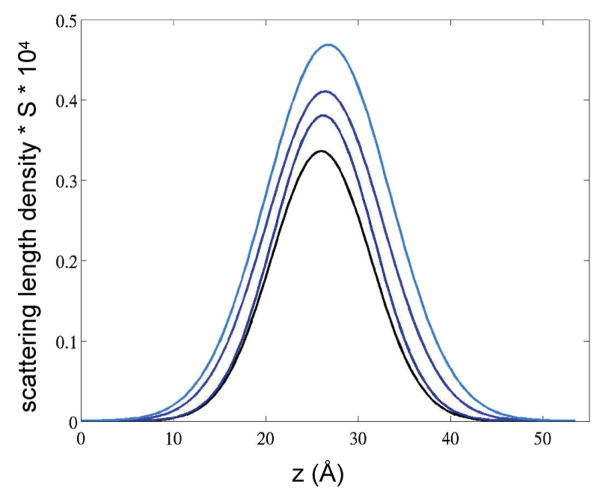
The stability of lipid bilayers is ultimately linked to the hydrophobic effect and the properties of water of hydration. Magic angle spinning (MAS) nuclear Overhauser enhancement spectroscopy (NOESY) with application of pulsed magnetic field gradients (PFG) was used to study the interaction of water with 1-palmitoyl-2-oleoyl-sn-glycero-3-phosphocholine bilayers in the fluid phase. NOESY cross-relaxation between water and polar groups of lipids, but also with methylene resonances of hydrophobic hydrocarbon chains, has been observed previously. This observation led to speculations that substantial amounts of water may reside in the hydrophobic core of bilayers. Here, the results of a quantitative analysis of cross-relaxation in a lipid 1-palmitoyl-2-oleoyl-sn-glycero-3 phosphocholine (POPC)/water mixture are reported. Coherences were selected via application of pulsed magnetic field gradients. This technique shortens acquisition times of NOESY spectra to 20 min and reduces t (1)-spectral noise, enabling detection of weak crosspeaks, like those between water and lipids, with higher precision than with non-gradient NOESY methods. The analysis showed that water molecules interact almost exclusively with sites of the lipid-water interface, including choline, phosphate, glycerol, and carbonyl groups. The lifetime of lipid-water associations is rather short, on the order of 100 ps, at least one order of magnitude shorter than the lifetime of lipid-lipid associations. The distribution of water molecules over the lipid bilayer was measured at identical water content by neutron diffraction. Water molecules penetrate deep into the interfacial region of bilayers but water concentration in the hydrophobic core is below the detection limit of one water molecule per lipid, in excellent agreement with the cross-relaxation data.
Figures


Similar articles
-
Studies of phospholipid hydration by high-resolution magic-angle spinning nuclear magnetic resonance.Biophys J. 1999 Jan;76(1 Pt 1):387-99. doi: 10.1016/S0006-3495(99)77205-X. Biophys J. 1999. PMID: 9876150 Free PMC article.
-
Lateral diffusion rates of lipid, water, and a hydrophobic drug in a multilamellar liposome.Biophys J. 2003 Sep;85(3):1734-40. doi: 10.1016/S0006-3495(03)74603-7. Biophys J. 2003. PMID: 12944288 Free PMC article.
-
Multi-dimensional pulsed field gradient magic angle spinning NMR experiments on membranes.Magn Reson Chem. 2004 Feb;42(2):115-22. doi: 10.1002/mrc.1329. Magn Reson Chem. 2004. PMID: 14745790
-
Sensing hydration and behavior of pyrene in POPC and POPC/cholesterol bilayers: a molecular dynamics study.Biochim Biophys Acta. 2013 Mar;1828(3):1094-101. doi: 10.1016/j.bbamem.2012.12.014. Epub 2012 Dec 26. Biochim Biophys Acta. 2013. PMID: 23274277
-
Solution NMR studies of cell-penetrating peptides in model membrane systems.Adv Drug Deliv Rev. 2013 Jul;65(8):1002-11. doi: 10.1016/j.addr.2012.10.011. Epub 2012 Nov 6. Adv Drug Deliv Rev. 2013. PMID: 23137785 Review.
Cited by
-
Interaction of an amphipathic peptide with phosphatidycholine/phosphatidylethanolamine mixed membranes.Biophys J. 2007 Dec 1;93(11):3900-6. doi: 10.1529/biophysj.107.108399. Epub 2007 Aug 17. Biophys J. 2007. PMID: 17704174 Free PMC article.
-
Water at the surfaces of aligned phospholipid multibilayer model membranes probed with ultrafast vibrational spectroscopy.J Am Chem Soc. 2008 Oct 22;130(42):13927-37. doi: 10.1021/ja803252y. Epub 2008 Sep 30. J Am Chem Soc. 2008. PMID: 18823116 Free PMC article.
-
Local Water Dynamics in Coacervated Polyelectrolytes Monitored Through Dynamic Nuclear Polarization-Enhanced H NMR.Macromolecules. 2009 Oct 13;42(19):7404-7412. doi: 10.1021/ma901137g. Macromolecules. 2009. PMID: 20814445 Free PMC article.
-
Effect of Cholesterol on the Structure of a Five-Component Mitochondria-Like Phospholipid Membrane.Membranes (Basel). 2015 Oct 30;5(4):664-84. doi: 10.3390/membranes5040664. Membranes (Basel). 2015. PMID: 26529029 Free PMC article.
-
Vibrational spectroscopy of water in hydrated lipid multi-bilayers. I. Infrared spectra and ultrafast pump-probe observables.J Chem Phys. 2011 Aug 21;135(7):075101. doi: 10.1063/1.3615717. J Chem Phys. 2011. PMID: 21861584 Free PMC article.
References
-
- Arndt UW, Willis BTM. Single crystal diffractometry. Cambridge Univerisity Press; Cambridge: 1966.
-
- Arnold K, Gawrisch K. Effects of fusogenic agents on membrane hydration: a deuterium nuclear magnetic resonance approach. Methods Enzymol. 1993;220:143–157. - PubMed
-
- Arnold K, Herrmann A, Pratsch L, Gawrisch K. The dielectric properties of aqueous solutions of poly(ethylene glycol) and their influence on membrane structure. Biochim Biophys Acta. 1985;815:515–518. - PubMed
-
- Bacon GE. Neutron diffraction. 3 rd. Clarendon Press; Oxford: 1975.
-
- Bacon GE, Lowde RD. Secondary extinction and neutron crystallography. Acta Cryst. 1948;1:303–314.
