

PPARalpha siRNA-treated expression profiles uncover the causal sufficiency network for compound-induced liver hypertrophy
- PMID: 17335344
- PMCID: PMC1808491
- DOI: 10.1371/journal.pcbi.0030030
PPARalpha siRNA-treated expression profiles uncover the causal sufficiency network for compound-induced liver hypertrophy
Abstract
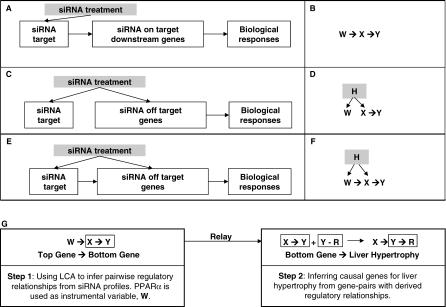
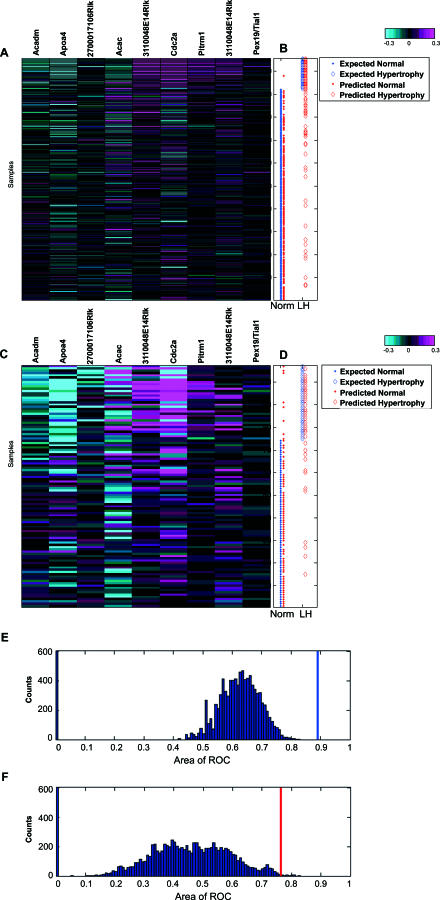
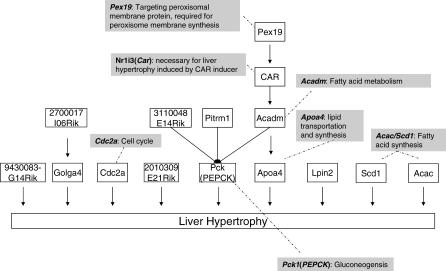
Uncovering pathways underlying drug-induced toxicity is a fundamental objective in the field of toxicogenomics. Developing mechanism-based toxicity biomarkers requires the identification of such novel pathways and the order of their sufficiency in causing a phenotypic response. Genome-wide RNA interference (RNAi) phenotypic screening has emerged as an effective tool in unveiling the genes essential for specific cellular functions and biological activities. However, eliciting the relative contribution of and sufficiency relationships among the genes identified remains challenging. In the rodent, the most widely used animal model in preclinical studies, it is unrealistic to exhaustively examine all potential interactions by RNAi screening. Application of existing computational approaches to infer regulatory networks with biological outcomes in the rodent is limited by the requirements for a large number of targeted permutations. Therefore, we developed a two-step relay method that requires only one targeted perturbation for genome-wide de novo pathway discovery. Using expression profiles in response to small interfering RNAs (siRNAs) against the gene for peroxisome proliferator-activated receptor alpha (Ppara), our method unveiled the potential causal sufficiency order network for liver hypertrophy in the rodent. The validity of the inferred 16 causal transcripts or 15 known genes for PPARalpha-induced liver hypertrophy is supported by their ability to predict non-PPARalpha-induced liver hypertrophy with 84% sensitivity and 76% specificity. Simulation shows that the probability of achieving such predictive accuracy without the inferred causal relationship is exceedingly small (p < 0.005). Five of the most sufficient causal genes have been previously disrupted in mouse models; the resulting phenotypic changes in the liver support the inferred causal roles in liver hypertrophy. Our results demonstrate the feasibility of defining pathways mediating drug-induced toxicity from siRNA-treated expression profiles. When combined with phenotypic evaluation, our approach should help to unleash the full potential of siRNAs in systematically unveiling the molecular mechanism of biological events.
Conflict of interest statement
Figures
Similar articles
-
Transcriptional and phenotypic comparisons of Ppara knockout and siRNA knockdown mice.Nucleic Acids Res. 2006;34(16):4486-94. doi: 10.1093/nar/gkl609. Epub 2006 Aug 31. Nucleic Acids Res. 2006. PMID: 16945951 Free PMC article.
-
Gene expression profiling of the PPAR-alpha agonist ciprofibrate in the cynomolgus monkey liver.Toxicol Sci. 2005 Nov;88(1):250-64. doi: 10.1093/toxsci/kfi273. Epub 2005 Aug 4. Toxicol Sci. 2005. PMID: 16081524
-
Identification of promethin and PGLP as two novel up-regulated genes in PPARgamma1-induced adipogenic mouse liver.Biochimie. 2004 Nov;86(11):743-61. doi: 10.1016/j.biochi.2004.09.015. Biochimie. 2004. PMID: 15589683
-
Gene silencing through RNA interference (RNAi) in vivo: strategies based on the direct application of siRNAs.J Biotechnol. 2006 Jun 25;124(1):12-25. doi: 10.1016/j.jbiotec.2005.12.003. Epub 2006 Jan 18. J Biotechnol. 2006. PMID: 16413079 Review.
-
Toxicogenomics of non-viral drug delivery systems for RNAi: potential impact on siRNA-mediated gene silencing activity and specificity.Adv Drug Deliv Rev. 2007 Mar 30;59(2-3):164-82. doi: 10.1016/j.addr.2007.03.010. Epub 2007 Mar 21. Adv Drug Deliv Rev. 2007. PMID: 17481774 Review.
Cited by
-
Chronic activation of FXR-induced liver growth with tissue-specific targeting Cyclin D1.Cell Cycle. 2019 Aug;18(15):1784-1797. doi: 10.1080/15384101.2019.1634955. Epub 2019 Jun 25. Cell Cycle. 2019. PMID: 31223053 Free PMC article.
-
Toxicogenomic biomarkers for liver toxicity.J Toxicol Pathol. 2009 Mar;22(1):35-52. doi: 10.1293/tox.22.35. Epub 2009 Apr 6. J Toxicol Pathol. 2009. PMID: 22271975 Free PMC article.
-
Identification of an inter-transcription factor regulatory network in human hepatoma cells by Matrix RNAi.Nucleic Acids Res. 2009 Mar;37(4):1049-60. doi: 10.1093/nar/gkn1028. Epub 2009 Jan 7. Nucleic Acids Res. 2009. PMID: 19129217 Free PMC article.
References
-
- Ganter B, Tugendreich S, Pearson CI, Ayanoglu E, Baumhueter S, et al. Development of a large-scale chemogenomics database to improve drug candidate selection and to understand mechanisms of chemical toxicity and action. J Biotechnol. 2005;119:219–244. - PubMed
-
- Hamadeh HK, Jayadev S, Gaillard ET, Huang Q, Stoll R, et al. Integration of clinical and gene expression endpoints to explore furan-mediated hepatotoxicity. Mutat Res. 2004;549:169–183. - PubMed
-
- Yang Y, Abel SJ, Ciurlionis R, Waring JF. Development of a toxicogenomics in vitro assay for the efficient characterization of compounds. Pharmacogenomics. 2006;7:177–186. - PubMed
-
- Waring JF, Cavet G, Jolly RA, McDowell J, Dai H, et al. Development of a DNA microarray for toxicology based on hepatotoxin-regulated sequences. EHP Toxicogenomics. 2003;111:53–60. - PubMed
-
- Burczynski ME, McMillian M, Ciervo J, Li L, Parker JB, et al. Toxicogenomics-based discrimination of toxic mechanism in HepG2 human hepatoma cells. Toxicol Sci. 2000;58:399–415. - PubMed
Publication types
MeSH terms
Substances
LinkOut - more resources
Full Text Sources
Molecular Biology Databases
