

Spatial acuity and prey detection in weakly electric fish
- PMID: 17335346
- PMCID: PMC1808493
- DOI: 10.1371/journal.pcbi.0030038
Spatial acuity and prey detection in weakly electric fish
Abstract
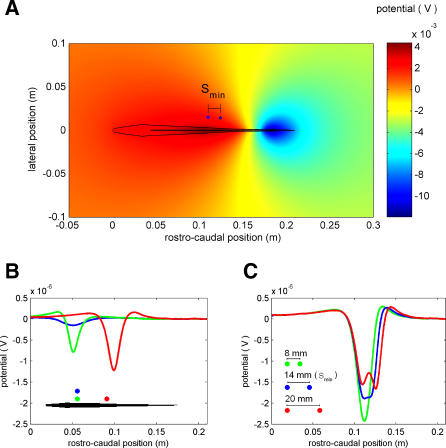
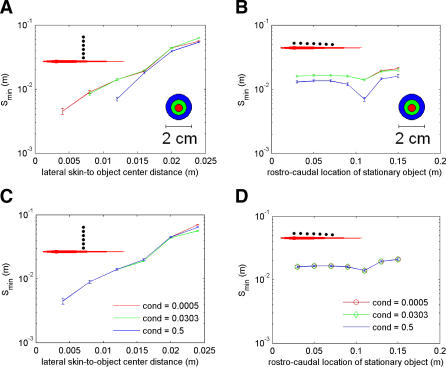
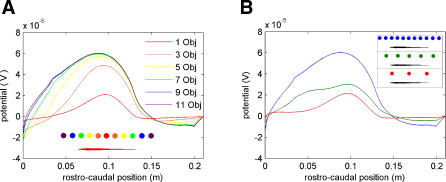
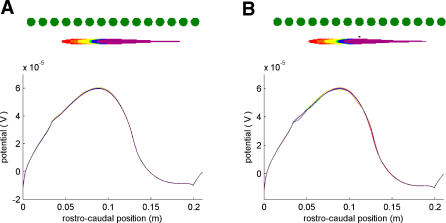
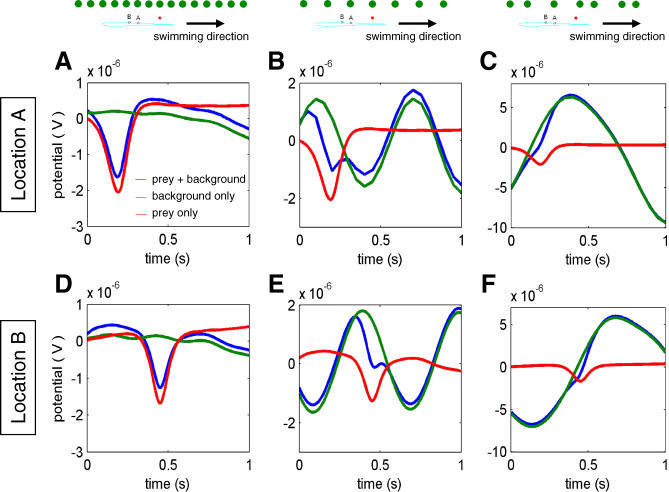
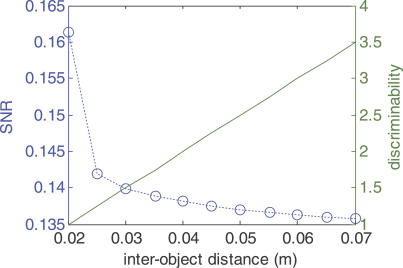
It is well-known that weakly electric fish can exhibit extreme temporal acuity at the behavioral level, discriminating time intervals in the submicrosecond range. However, relatively little is known about the spatial acuity of the electrosense. Here we use a recently developed model of the electric field generated by Apteronotus leptorhynchus to study spatial acuity and small signal extraction. We show that the quality of sensory information available on the lateral body surface is highest for objects close to the fish's midbody, suggesting that spatial acuity should be highest at this location. Overall, however, this information is relatively blurry and the electrosense exhibits relatively poor acuity. Despite this apparent limitation, weakly electric fish are able to extract the minute signals generated by small prey, even in the presence of large background signals. In fact, we show that the fish's poor spatial acuity may actually enhance prey detection under some conditions. This occurs because the electric image produced by a spatially dense background is relatively "blurred" or spatially uniform. Hence, the small spatially localized prey signal "pops out" when fish motion is simulated. This shows explicitly how the back-and-forth swimming, characteristic of these fish, can be used to generate motion cues that, as in other animals, assist in the extraction of sensory information when signal-to-noise ratios are low. Our study also reveals the importance of the structure of complex electrosensory backgrounds. Whereas large-object spacing is favorable for discriminating the individual elements of a scene, small spacing can increase the fish's ability to resolve a single target object against this background.
Conflict of interest statement
Figures
Similar articles
-
Omnidirectional sensory and motor volumes in electric fish.PLoS Biol. 2007 Nov;5(11):e301. doi: 10.1371/journal.pbio.0050301. PLoS Biol. 2007. PMID: 18001151 Free PMC article.
-
Receptive field organization across multiple electrosensory maps. II. Computational analysis of the effects of receptive field size on prey localization.J Comp Neurol. 2009 Oct 10;516(5):394-422. doi: 10.1002/cne.22120. J Comp Neurol. 2009. PMID: 19655388
-
Prey capture in the weakly electric fish Apteronotus albifrons: sensory acquisition strategies and electrosensory consequences.J Exp Biol. 1999 May;202(Pt 10):1195-203. doi: 10.1242/jeb.202.10.1195. J Exp Biol. 1999. PMID: 10210661
-
Peripheral electrosensory imaging by weakly electric fish.J Comp Physiol A Neuroethol Sens Neural Behav Physiol. 2006 Jun;192(6):587-600. doi: 10.1007/s00359-006-0100-2. Epub 2006 Feb 25. J Comp Physiol A Neuroethol Sens Neural Behav Physiol. 2006. PMID: 16501980 Review.
-
Non-visual environmental imaging and object detection through active electrolocation in weakly electric fish.J Comp Physiol A Neuroethol Sens Neural Behav Physiol. 2006 Jun;192(6):601-12. doi: 10.1007/s00359-006-0096-7. Epub 2006 Jan 28. J Comp Physiol A Neuroethol Sens Neural Behav Physiol. 2006. PMID: 16645886 Review.
Cited by
-
Weak signal amplification and detection by higher-order sensory neurons.J Neurophysiol. 2016 Apr;115(4):2158-75. doi: 10.1152/jn.00811.2015. Epub 2016 Feb 3. J Neurophysiol. 2016. PMID: 26843601 Free PMC article.
-
Long-term behavioral tracking of freely swimming weakly electric fish.J Vis Exp. 2014 Mar 6;(85):50962. doi: 10.3791/50962. J Vis Exp. 2014. PMID: 24637642 Free PMC article.
-
Fish geometry and electric organ discharge determine functional organization of the electrosensory epithelium.PLoS One. 2011;6(11):e27470. doi: 10.1371/journal.pone.0027470. Epub 2011 Nov 11. PLoS One. 2011. PMID: 22096578 Free PMC article.
-
Sensory Cues Modulate Smooth Pursuit and Active Sensing Movements.Front Behav Neurosci. 2019 Apr 8;13:59. doi: 10.3389/fnbeh.2019.00059. eCollection 2019. Front Behav Neurosci. 2019. PMID: 31024269 Free PMC article.
-
Coding of object location by heterogeneous neural populations with spatially dependent correlations in weakly electric fish.PLoS Comput Biol. 2023 Mar 3;19(3):e1010938. doi: 10.1371/journal.pcbi.1010938. eCollection 2023 Mar. PLoS Comput Biol. 2023. PMID: 36867650 Free PMC article.
References
-
- Moller P. Electric fishes: History and behavior. London: Chapman and Hall; 1995. 612
-
- Crampton WGR. Electric signal design and habitat preferences in a species rich assemblage of gymnotiform fishes from the Upper Amazon basin. An Acad Bras Cięnc. 1998;70:805–847.
-
- Lissman HW, Machin KE. The mechanism of object location in Gymnarchus niloticus and similar fish. J Exp Biol. 1958;35:451–486.
-
- Knudsen EI. Spatial aspects of the electric fields generated by weakly electric fish. J Comp Physiol. 1975;99:103–118.
-
- Rasnow B. The effects of simple objects on the electric field of Apteronotus . J Comp Physiol A. 1996;178:397–411.
Publication types
MeSH terms
LinkOut - more resources
Full Text Sources
