. 2007 Mar;12(3):415-29.
doi: 10.1016/j.devcel.2006.12.011.

Notch signaling is essential for ventricular chamber development

Affiliations

Notch signaling is essential for ventricular chamber development

Joaquín Grego-Bessa et al. Dev Cell. 2007 Mar.

Abstract

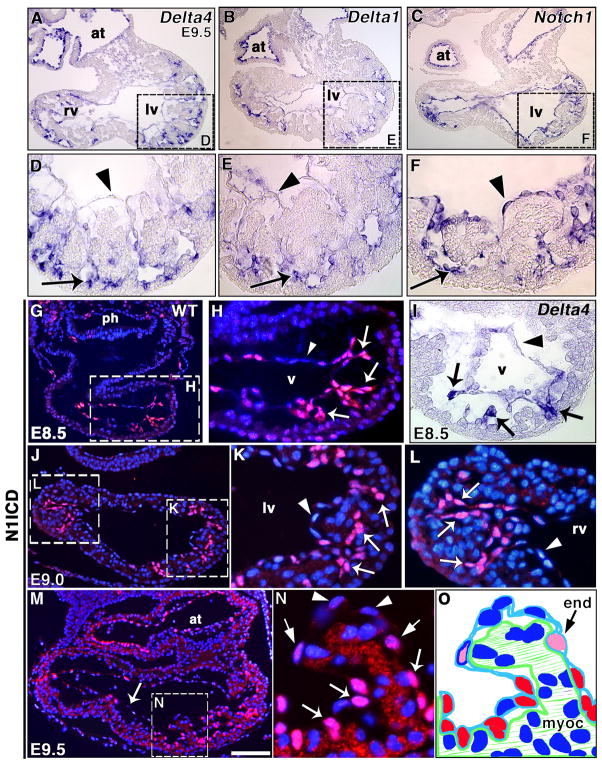
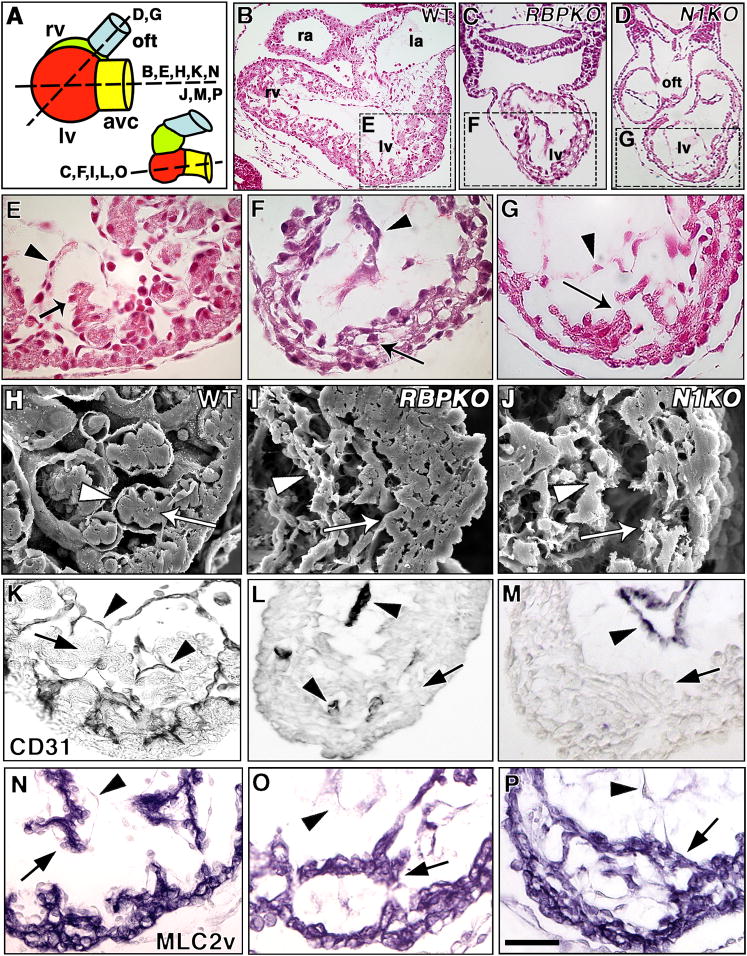
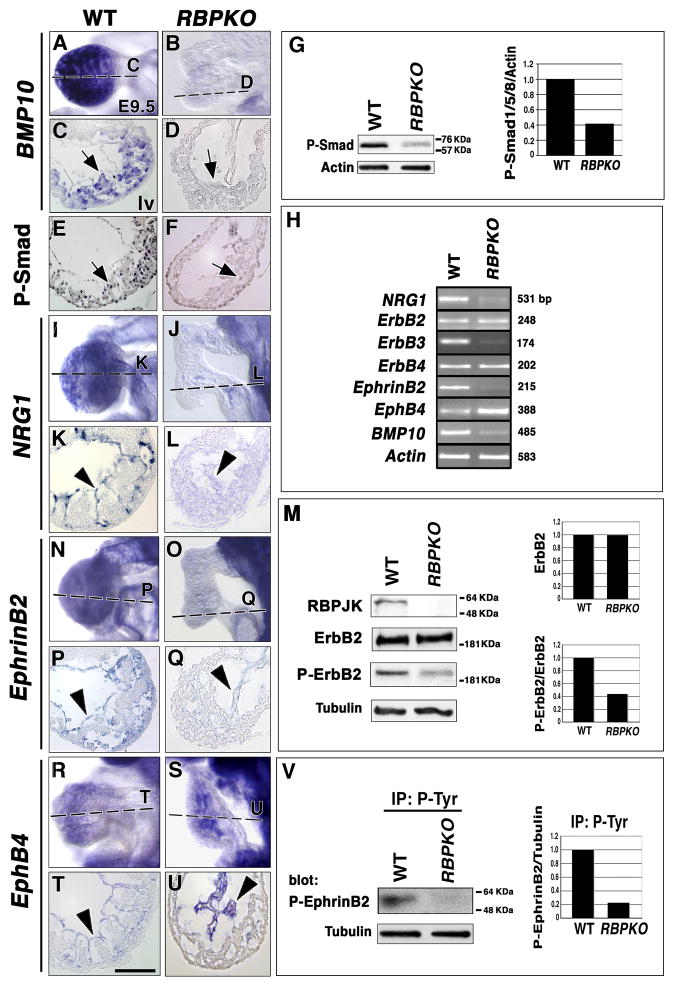
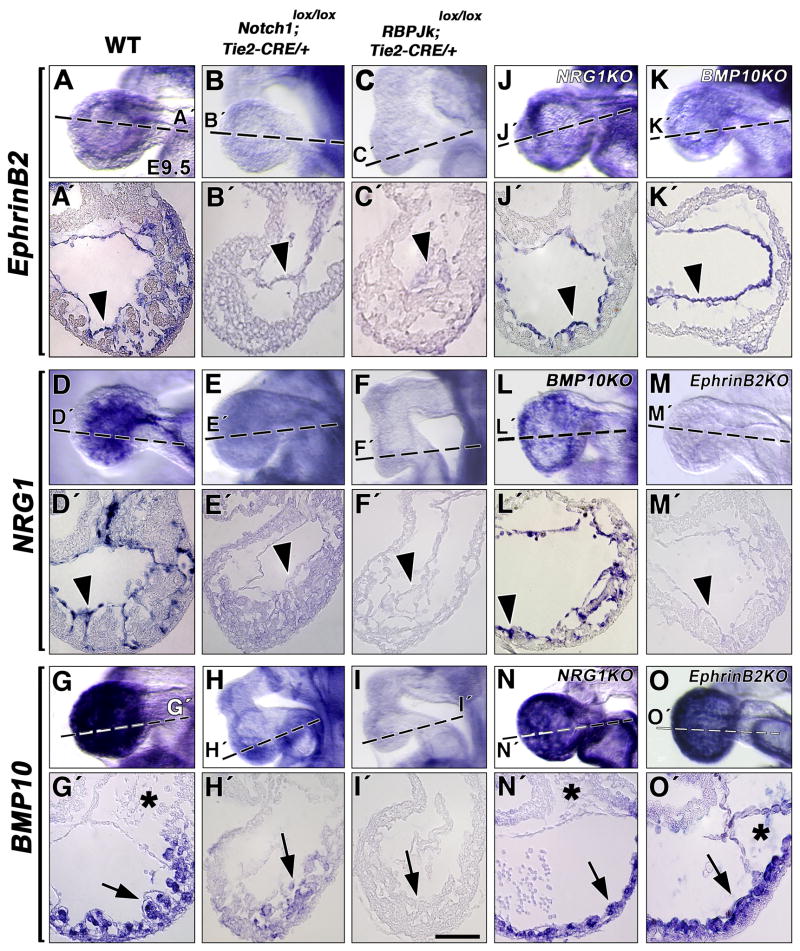
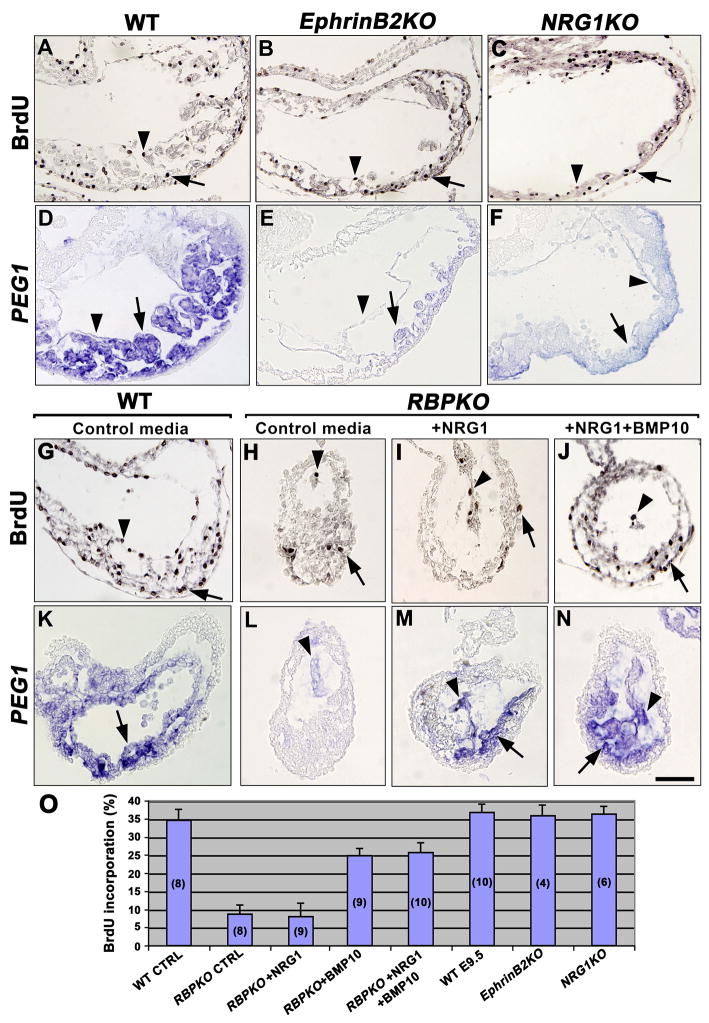
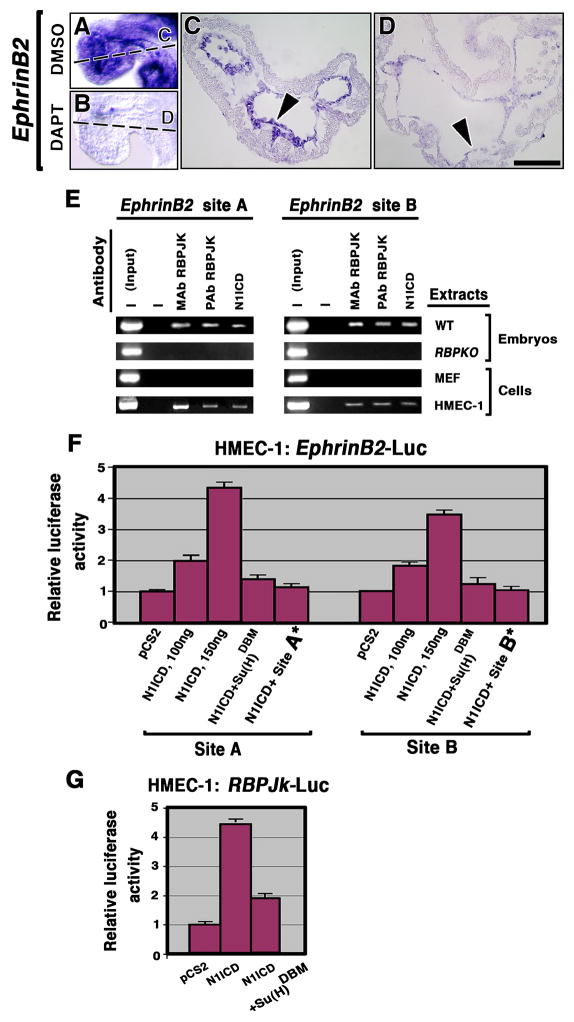
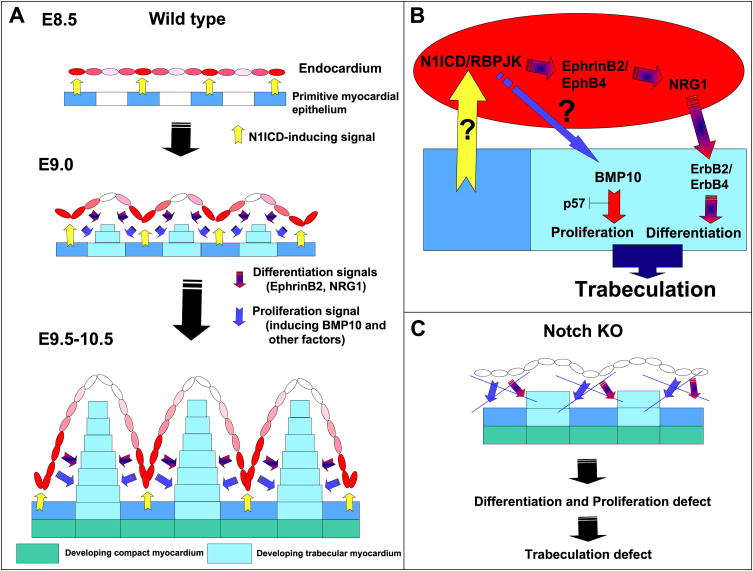
Ventricular chamber morphogenesis, first manifested by trabeculae formation, is crucial for cardiac function and embryonic viability and depends on cellular interactions between the endocardium and myocardium. We show that ventricular Notch1 activity is highest at presumptive trabecular endocardium. RBPJk and Notch1 mutants show impaired trabeculation and marker expression, attenuated EphrinB2, NRG1, and BMP10 expression and signaling, and decreased myocardial proliferation. Functional and molecular analyses show that Notch inhibition prevents EphrinB2 expression, and that EphrinB2 is a direct Notch target acting upstream of NRG1 in the ventricles. However, BMP10 levels are found to be independent of both EphrinB2 and NRG1 during trabeculation. Accordingly, exogenous BMP10 rescues the myocardial proliferative defect of in vitro-cultured RBPJk mutants, while exogenous NRG1 rescues differentiation in parallel. We suggest that during trabeculation Notch independently regulates cardiomyocyte proliferation and differentiation, two exquisitely balanced processes whose perturbation may result in congenital heart disease.


Figures

Figure 1
Figure 1. Notch is active in the developing trabeculae
(A–F) Delta4, Delta1 and Notch1 transcription in E9.5 wt heart by WISH. Delta4 (A, D) and Delta1 (B, E) transcribe preferentially in the endocardium at the base of trabeculae (arrows); little or no transcript is detected in distal endocardium (arrowheads). Notch1 (C, F) is uniformly transcribed in ventricular endocardium (arrow and arrowhead). (G–N) N1ICD staining (red), nuclei counterstained with DAPI (blue). (G, H) General heart view at E8.5 (G) and detail of ventricle (H). Note strong N1ICD expression in endocardium at the base of presumptive trabeculae (arrows) and no signal in distal endocardium (arrowhead). (I) Delta4 transcription at the base of nascent trabeculae (arrows) at E8.5. (J) E9.0 general heart view; note strong N1ICD staining in both ventricles. (K, L) Left (K) and right (L) ventricles with strong N1ICD staining in endocardium at the base of trabeculae (arrows), and no signal in distal endocardium (arrowhead). (M) E9.5 general heart view, strong N1ICD expression in ventricles and atrium, weaker expression in interventricular endocardium (arrow). (N) Detail of trabecula in left ventricle. Note strong N1ICD expression at the base (arrows) and progressively reduced signal at the middle (thin arrows) and distal tip (arrowheads). (O) Schematic representation of the trabecula shown in (N). The red color indicates strong N1ICD staining and the pink color indicates weak staining. at, atrium; end, endocardium; myoc, myocardium; ph, pharynx; lv, left ventricle; rv, right ventricle; v, ventricle. All panels are transverse sections. Scale bar, 100 μm in A–C, G, J, M; 25 μm in D–F, H, I, K, L; 80 μm in G; 15 μm in N.
Figure 2
Figure 2. Defective trabeculation in E9.5 Notch1 and RBPJk mutants
(A) Schematic representation of E9.5 wt or Notch1 (left) and RBPJk mutant hearts (right), depicting a lateral view of cardiac chambers. Section levels shown in (B–P) are indicated. In RBPJk mutants, the ventricles are aligned along the A–P axis. avc, AV canal; oft, outflow tract. (B–G) H+E-stained transverse sections and (H–J) SEM photomicrographs. (B, C, D) General views of representative wt (B), RBPJk (C) and Notch1 (D) mutants at the level of ventricles. Details of wt left ventricle (E, H), note developing trabeculae with myocardium (E, H, arrows) and endocardium (arrowheads); left ventricles of RBPJk (F, I) and Notch1 (G, J) mutants. RBPJk and Notch1 embryos show collapsed endocardium (arrowheads), disorganized myocardium (arrows) and poorly developed trabeculae. (K–M) Endocardial CD31/PECAM staining (arrowheads) in the left ventricle of wt (K), RBPJk (L) and Notch1 (M) embryos. In wt trabeculae the myocardium (arrow) is surrounded by endocardium (arrowhead). Arrowheads in (L, M) show endocardium and arrows indicate myocardium. (N-P) MLC2v staining in wt (N), RBPJk (O) and Notch1 (P) embryos show MLC2v expression throughout myocardium including trabeculae (arrow). Arrowheads indicate endocardium. la, left atrium; oft, outflow tract; ra, right atrium. Scale bar, 100 μm in B–D; 25 μm in D–P.
Figure 3
Figure 3. Impaired BMP10, NRG1 and EphrinB2 expression and activity in RBPJk mutants
BMP10 transcription in E9.5 wt trabecular myocardium (A, C) is reduced in RBPJk mutants (B, D). P–Smad1/5/8 ventricular expression in wt myocardium (E, arrow) is reduced in RBPJk mutants (F, arrow). (G) Left: Western blot with anti-P-Smad1/5/8 antibody in wt and RBPJk mutant ventricles. Right: Ratio of P-Smad1/5/8 expression to actin. (H) Semiquantitative RT-PCR analysis in E9.5 wt and RBPJk mutant hearts. wt endocardial NRG1 expression (I, K) is reduced in RBPJk mutants (J, L). (M) Western blot of E9.5 cardiac extracts shows no RBPJK protein expression, relatively normal ErbB2 receptor levels and reduced activated ErbB2 receptor levels (P-ErbB2) in RBPJk mutants. Top right: Ratio of total ErbB2 levels in wt and mutants. Bottom right: Ratio of P-ErbB2 to total ErbB2 levels. (N, P) EphrinB2 expression in wt endocardium is greatly reduced in RBPJk mutants (O, Q). Endocardial EphB4 expression (R, T) is increased in RBPJK mutants (S, U). (V) Immunoprecipitation with pTyr and western blot with anti-phosphorylated EphrinB2 antibody. Right: Normalized phospho-EphrinB2 levels. In (G, M, V) representative results from three experiments with two independent sets of extracts are shown. Arrows in (C–F) show myocardium and arrowheads endocardium. All sections show left ventricle. Scale bar, 25 μm.
Figure 4
Figure 4. Expression analysis in endocardial-specific Notch mutants and standard targeted EphrinB2, NRG1 and BMP10 mutants
WISH, E9.5. (A, A′) EphrinB2 expression in wt embryos; reduction in Notch1lox/lox; Tie2-CRE (B, B′) and RBPJklox/lox; Tie2-CRE (C, C′) mutants. (D, D′) NRG1 expression in wt; reduction in Notch1lox/lox; Tie2-CRE (E, E′) and RBPJklox/lox; Tie2-CRE (F, F′) mutants. (G, G′) BMP10 expression in wt; reduction in Notch1lox/lox; Tie2-CRE (H, H′) and RBPJklox/lox; Tie2-CRE (I, I′) mutants. Normal EphrinB2 transcription in E9.5 NRG1 (J, J′) and BMP10 mutants (K, K′). Normal NRG1 expression in BMP10 mutants (L, L′) and marked reduction in EphrinB2 mutants (M, M′). BMP10 expression in NRG1 (N, N′) and EphrinB2 (O, O′) mutants. Arrowheads point to endocardium and arrows to myocardium. Asterisks indicate endocardial cushion of the AV canal, devoid of mesenchymal cells in EphrinB2 mutants. Scale bar, 25 m.
Figure 5
Figure 5. Cardiac proliferation and marker analysis of EphrinB2 and NRG1 mutants and in vitro cytokine rescue experiment with RBPJk mutants
(A–C) BrdU staining in endocardium and myocardium of E9.5 wt (A), EphrinB2 (B) and NRG1 (C) mutants. Positive cells in endocardium are indicated with arrowheads and with arrows in myocardium. (D–F) PEG1 expression in trabecular myocardium and endocardium of wt embryo (D), and severe reduction in EphrinB2 (E) and NRG1 (F) mutants. Arrowheads indicate endocardium and arrows myocardium. (G–J) BrdU staining in wt (G) and RBPJk mutants cultured in control media (H), media with NRG1 (I) and media with NRG1 plus BMP10 (J). (K–N) PEG1 expression in wt (K) and RBPJk mutants cultured in control media (L), media with NRG1 (M) and media with NRG1 plus BMP10 (N). (O) Quantification of BrdU incorporation. The values are means of BrdU-positive nuclei. The number of embryos analyzed is indicated in parenthesis inside of bars. Scale bar, 40 μm.
Figure 6
Figure 6. EphrinB2 is a Notch target in the endocardium
(A–D) WISH showing EphrinB2 expression in E9.5 DMSO control (A, C, arrowhead) and severe reduction in DAPT-treated embryos (B, D, arrowhead). (E) ChIP assays. Chromatin from E9.5 wt and RBPJk mutant hearts, MEF and HMEC-1 cells was immunoprecipitated with monoclonal (MAb) or polyclonal (PAb) antibodies against RBPJK or N1ICD. The EphrinB2 genomic DNA was analyzed for RBPJK binding sites A and B. “Input” corresponds to PCR products generated using DNA from non-immunoprecipitated chromatin as a template. —, no antibody was added to the reaction mixture. (F) Luciferase reporter assays. HMEC-1 cells were co-transfected with Renilla luciferase plasmid and 100 or 150ng of N1ICD, Su(H)DBM effector plasmid or a control plasmid (empty pCS2 vector), in combination with a reporter plasmid containing wt RBPJK binding sites (A or B) or mutated ones (A* or B*). (G) HMEC-1 cells transfected with empty vector, N1ICD or Su(H)DBM and RBPJk reporter plasmid. After normalization to Renilla luciferase activity, firefly luciferase activity relative to that of control plasmid was calculated for each reporter. Relative values (mean+SD) from at least four independent experiments performed in triplicate are represented by the bars in the bar chart. Scale bar, 25 μm (C, D).
Figure 7
Figure 7. A model for Notch activity in ventricular development
(A) E8.5 wt embryo. A myocardial cue (yellow) leads to N1ICD expression (red) in specific endocardial regions. At E9.0, N1ICD/RBPJK activate endocardial EphrinB2 leading to NRG1 expression. NRG1 activates the ErbB2/B4 receptors in myocardium to induce trabecular muscle differentiation. As the trabecular ridge develops, the endocardium separates from the myocardial N1ICD-inducing cue, and N1ICD is down-regulated (pink) at the tip of the trabeculae. At E9.5-10.5, N1ICD is higher in the endocardium at the base of the trabeculae, and the ventricular myocardium has differentiated into compact zone (green) and trabecular myocardium (blue) regions. The different intensity of N1ICD expression (pink or red) represents the predominant N1ICD activation at the base of trabeculae in response to a spatially restricted myocardial cue. (B) Molecular pathways downstream of Notch during trabeculation. (C) In Notch mutants, proliferation and differentiation signals are disrupted and trabeculation is impaired.

References

    1. Artavanis-Tsakonas S, Rand MD, Lake RJ. Notch signaling: cell fate control and signal integration in development. Science. 1999;284:770–776. - PubMed
    1. Bailey AM, Posakony JW. Suppressor of hairless directly activates transcription of enhancer of split complex genes in response to Notch receptor activity. Genes Dev. 1995;9:2609–2622. - PubMed
    1. Ben-Shachar G, Arcilla RA, Lucas RV, Manasek FJ. Ventricular trabeculations in the chick embryo heart and their contribution to ventricular and muscular septal development. Circ Res. 1985;57:759–766. - PubMed
    1. Chen H, Shi S, Acosta L, Li W, Lu J, Bao S, Chen Z, Yang Z, Schneider MD, Chien KR, et al. BMP10 is essential for maintaining cardiac growth during murine cardiogenesis. Development. 2004;131:2219–2231. - PMC - PubMed
    1. Conlon RA, Reaume AG, Rossant J. Notch1 is required for the coordinate segmentation of somites. Development. 1995;121:1533–1545. - PubMed

Publication types

MeSH terms