. 2007 Apr;143(4):1452-66.
doi: 10.1104/pp.107.095760. Epub 2007 Mar 2.

PlanTAPDB, a phylogeny-based resource of plant transcription-associated proteins

Affiliations

PlanTAPDB, a phylogeny-based resource of plant transcription-associated proteins

Sandra Richardt et al. Plant Physiol. 2007 Apr.

Abstract

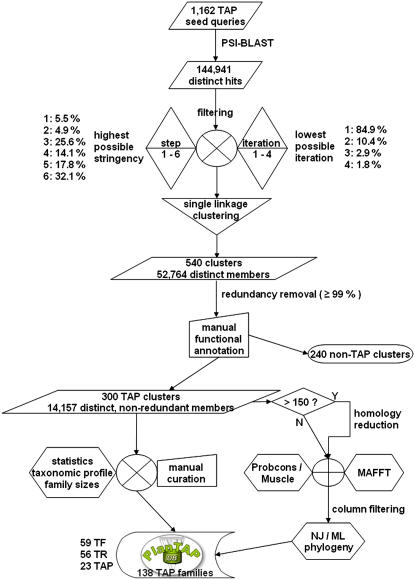
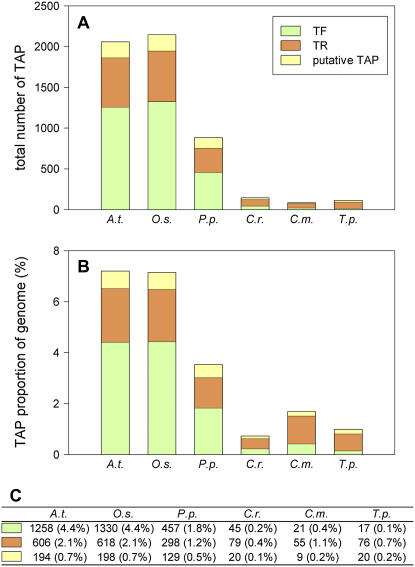
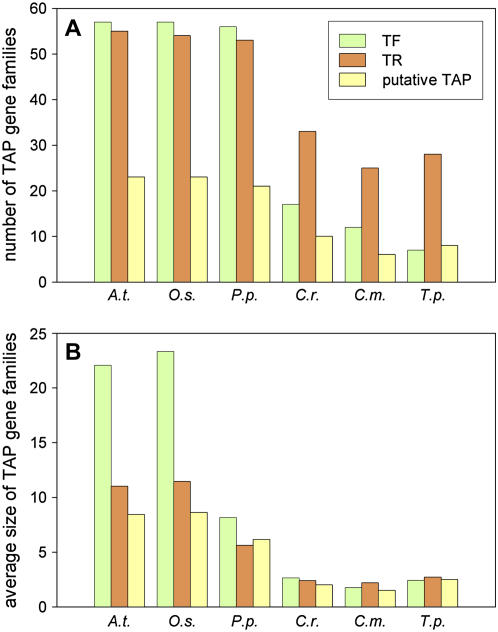
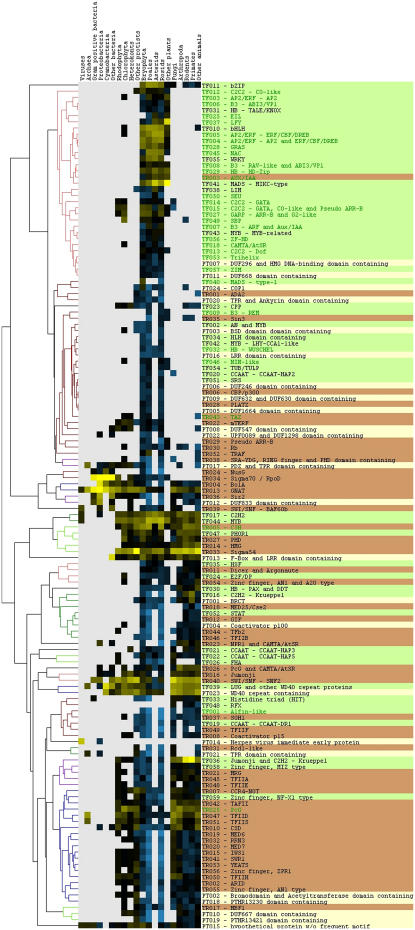
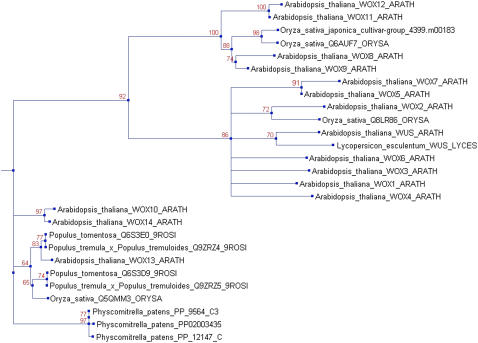
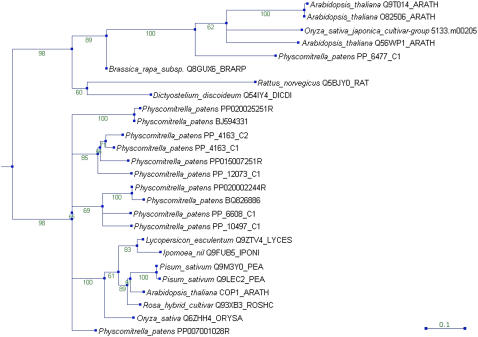
Diversification of transcription-associated protein (TAP) families during land plant evolution is a key process yielding increased complexity of plant life. Understanding the evolutionary relationships between these genes is crucial to gain insight into plant evolution. We have determined a substantial set of TAPs that are focused on, but not limited to, land plants using PSI-BLAST searches and subsequent filtering and clustering steps. Phylogenies were created in an automated way using a combination of distance and maximum likelihood methods. Comparison of the data to previously published work confirmed their accuracy and usefulness for the majority of gene families. Evidence is presented that the flowering plant apical stem cell regulator WUSCHEL evolved from an ancestral homeobox gene that was already present after the water-to-land transition. The presence of distinct expanded gene families, such as COP1 and HIT in moss, is discussed within the evolutionary backdrop. Comparative analyses revealed that almost all angiosperm transcription factor families were already present in the earliest land plants, whereas many are missing among unicellular algae. A global analysis not only of transcription factors but also of transcriptional regulators and novel putative families is presented. A wealth of data about plant TAP families and all data accrued throughout their automated detection and analysis are made available via the PlanTAPDB Web interface. Evolutionary relationships of these genes are readily accessible to the nonexpert at a mouse-click. Initial analyses of selected gene families revealed that PlanTAPDB can easily be exerted for knowledge discovery.


Figures

Figure 1.
Figure 1.
Flowchart of TreePipe and PlanTAPDB. [See online article for color version of this figure.]
Figure 2.
Figure 2.
Abundance of plant TAP genes. The absolute (A) and relative (B) amounts of TAP genes in six species (see Supplemental Table S1 for abbreviations) are shown as bar charts and numerical values (C). The absolute gene numbers were inferred from the NCBI taxonomy information of all TAP family members. The relative abundance of TAPs is shown in relation to the total number of predicted proteins within the respective organism. TFs are shown in green, TRs in orange, and PTs in yellow.
Figure 3.
Figure 3.
Number and size of plant TAP families. Number (A) and average gene family size (B) of TAP families in six species (see Supplemental Table S1 for abbreviations) are shown. The average gene family size was calculated as the ratio of absolute number of family members per number of families. TFs are shown in green, TRs in orange, and PTs in yellow.
Figure 4.
Figure 4.
Taxonomic profile of the plant TAP families. The NCBI taxonomy information for all family members was parsed per annotated TAP family. The columns represent those taxonomic groups that contributed significantly to the distribution; the remainder of the Eubacteria, protists, plants, and animals are represented as “other,” respectively. After normalization of the columns (log odds ratio), the rows were clustered and visualized as a heat map (yellow = overrepresented, blue = underrepresented, black = average representation, gray = missing). In the case of overrepresentation and underrepresentation, the color intensity increases with rising distance from zero. All clusters with a centered Pearson correlation coefficient R ≥ 0.7 are displayed in color to the left of the heat map. The PlanTAPDB family names and annotations are shown to the right (green: TF; orange: TR; yellow: PT; green text: previously described as plant specific).
Figure 5.
Figure 5.
Phylogeny of the WUS/WOX gene family. A manually expanded phylogeny of the PlanTAPDB WUS family (TF032_337) is presented. The ML tree is shown with quartet support values at the nodes. The protein sequences are represented by species name and accession number. [See online article for color version of this figure.]
Figure 6.
Figure 6.
Phylogeny of the COP1/SPA gene family. The automatically generated PlanTAPDB phylogeny of the COP1 family (PT024) is presented. The consensus tree of 100 bootstrapped NJ trees with ML branch lengths is shown; bootstrap values are shown at the nodes. The protein sequences are represented by species name and accession number. [See online article for color version of this figure.]

References

    1. Altschul SF, Madden TL, Schaffer AA, Zhang J, Zhang Z, Miller W, Lipman DJ (1997) Gapped BLAST and PSI-BLAST: a new generation of protein database search programs. Nucleic Acids Res 25 3389–3402 - PMC - PubMed
    1. Benjamini Y, Hochberg Y (1995) Controlling the false discovery rate: a practical and powerful approach to multiple testing. J R Stat Soc Ser B 57 289–300
    1. Benton D (1990) Recent changes in the GenBank On-line Service. Nucleic Acids Res 18 1517–1520 - PMC - PubMed
    1. Bierfreund NM, Tintelnot S, Reski R, Decker EL (2004) Loss of GH3 function does not affect phytochrome-mediated development in a moss, Physcomitrella patens. J Plant Physiol 161 823–835 - PubMed
    1. Blanc G, Wolfe KH (2004) Functional divergence of duplicated genes formed by polyploidy during Arabidopsis evolution. Plant Cell 16 1679–1691 - PMC - PubMed

Publication types

Substances