. 2007 Mar;19(3):731-49.
doi: 10.1105/tpc.106.047688. Epub 2007 Mar 2.

Analysis of transcription factor HY5 genomic binding sites revealed its hierarchical role in light regulation of development

Affiliations

Analysis of transcription factor HY5 genomic binding sites revealed its hierarchical role in light regulation of development

Jungeun Lee et al. Plant Cell. 2007 Mar.

Abstract

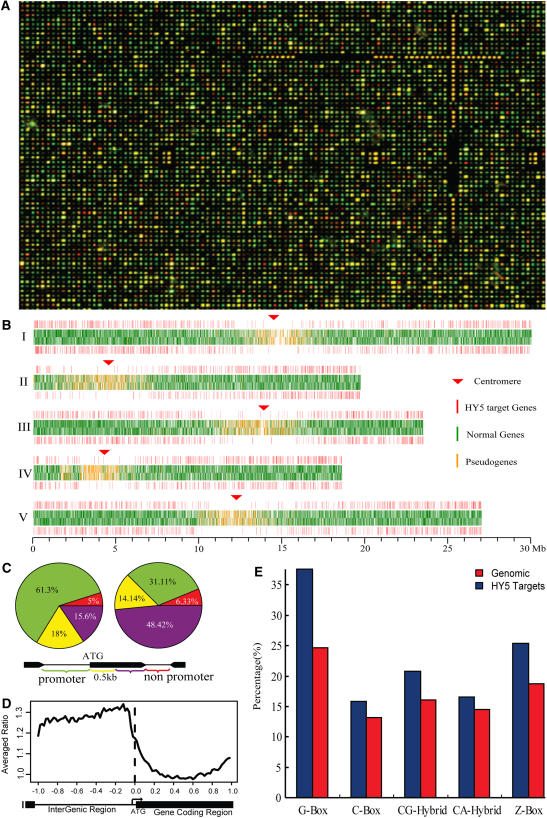
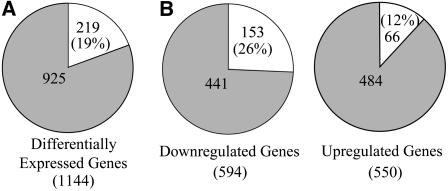
The transcription factor LONG HYPOCOTYL5 (HY5) acts downstream of multiple families of the photoreceptors and promotes photomorphogenesis. Although it is well accepted that HY5 acts to regulate target gene expression, in vivo binding of HY5 to any of its target gene promoters has yet to be demonstrated. Here, we used a chromatin immunoprecipitation procedure to verify suspected in vivo HY5 binding sites. We demonstrated that in vivo association of HY5 with promoter targets is not altered under distinct light qualities or during light-to-dark transition. Coupled with DNA chip hybridization using a high-density 60-nucleotide oligomer microarray that contains one probe for every 500 nucleotides over the entire Arabidopsis thaliana genome, we mapped genome-wide in vivo HY5 binding sites. This analysis showed that HY5 binds preferentially to promoter regions in vivo and revealed >3000 chromosomal sites as putative HY5 binding targets. HY5 binding targets tend to be enriched in the early light-responsive genes and transcription factor genes. Our data thus support a model in which HY5 is a high hierarchical regulator of the transcriptional cascades for photomorphogenesis.


Figures

Figure 1.
Figure 1.
ChIP Confirms that HY5 Binds to the Promoters of CHS and RbcS1A in Vivo. (A) The HA:HY5 transgene complements the phenotype of the hy5 mutant. Wild-type (left), hy5 (middle), and HA:HY5 in hy5 (right) seedlings were grown under white light. (B) The HA:HY5 protein amount in the HA:HY5 transgenic line is similar to that of endogenous HY5 in the wild type. Total soluble protein extracts from 4-d-old white light–grown seedlings from each genotype were separated and immunoblotted with HY5-specific antibody (top) and RPN6-specific antibody (bottom). Asterisks indicate nonspecific cross-reacting protein. RPN6 shows the equal loading of proteins. (C) ChIP with anti (α)-HA antibody for two positive controls, promoters of CHS and RbcS1A, and a negative control, At4g26900. Input control from nonimmunoprecipitated genomic DNA is shown at bottom. IP, immunoprecipitate. (D) ChIP with αHY5 antibody. Input control is shown at bottom.
Figure 2.
Figure 2.
Effect of Light on HY5 in Vivo Binding Activity. (A) HA:HY5 protein levels in different light conditions. HA:HY5 was grown under Wc, Rc, FRc, or Bc for 4 d, and total protein extracts were separated and immunoblotted with anti (α)-HA antibody. Wild type (Col) grown under white light is shown as a control. (B) ChIP with αHA antibody for the two promoters of CHS and RbcS1A and the negative control At4g26900. C indicates wild type; H indicates HA:HY5. (C) Effect on HY5 protein levels of the light-to-dark transition. Wild-type and HA:HY5 plants were grown under white light for 4 d, then transferred to dark. Total proteins were extracted at 1-h intervals after dark transfer. Arrowheads at left and right denote endogenous HY5 and HA:HY5 proteins, respectively. The half-life of HA:HY5 is ∼1 h. (D) HY5 proteins remain in the nucleus after the light-to-dark transition. Wild-type and hy5 plants were grown under Wc light, then transferred to dark for 8 h. After nuclei isolation, proteins were extracted from the cytoplasmic fraction and the nuclear fraction. The purity of the nuclear fraction was demonstrated by specific antibody against histone 3, and the purity of the cytoplasmic fraction was demonstrated by Ponceau staining of ribulose-1,5-bis-phosphate carboxylase/oxygenase (Rubisco) protein. Neither histone 3 nor HY5 is detected in the cytoplasmic fraction. After 8 h of transition to darkness, HY5 protein in the nuclear fraction is reduced by ∼20%. (E) The daily rhythm of endogenous HY5 protein level. Wild-type plants were grown under long days (16 h of light, 8 h of dark) for 4 d, then total protein was extracted every 4 h. The level of HY5 protein does not show significant diurnal change. ZT, Zeitgeber time. (F) ChIP with αHY5 antibody for the promoters of CHS and RbcS1A and the negative control At4g26900. The hy5 control and wild-type Columbia were grown under Wc light for 4 d (L), then half of the wild-type samples were transferred to dark conditions for 8 h of incubation (D). IP, immunoprecipitate. (G) ChIP with αHY5 antibody for the promoters of CHS and RbcS1A and the negative control At4g26900. Wild-type plants were grown under long days for 4 d, then harvested at dusk (16 h after light on) and dawn (8 h after light off). The hy5 control tissues were harvested at dusk with the wild-type tissues. Input control is shown at bottom.
Figure 3.
Figure 3.
Overview of Genome-Wide HY5 Binding Analysis. (A) A representative microarray hybridization result showing part of the chip. Only a 1/400th area of the chip is shown. The images of Cy5 (red) for enriched DNA by HY5 and Cy3 (green) for input genomic control DNA are merged. (B) Distribution of HY5 target genes throughout the five chromosomes of Arabidopsis. The two top bars are for genes oriented 5′ to 3′, and the two bottom bars are for genes oriented 3′ to 5′. The putative HY5 target genes are depicted in red bars at the uppermost and lowermost positions. For the two middle bars, normal genes are depicted in green and pseudogenes are depicted in yellow. (C) The distribution of the positions of HY5 binding sites (left) relative to the gene structure was compared with the whole genome (right). A scheme illustrating each position of a binding site in relation to a transcription unit is shown at bottom. The percentages of binding sites at each position are shown. (D) Frequency of HY5 binding sites (as viewed through the averaged ratio of ChIP hybridization signal to the total genomic control) along the virtually normalized gene models of the whole Arabidopsis genome. (E) Percentage of putative target genes in which promoters contain HY5 binding consensus sites—G box, C box, CG hybrid, CA hybrid, and Z box—compared with the whole genome.
Figure 4.
Figure 4.
Functional Classification of the HY5 Binding Target Genes. Part of the top functional categories of HY5 target genes using the Munich Information Center for Protein Sequences FunCat website. Transcription factors were identified based on the Database of Arabidopsis Transcription Factors and are indicated with a pink background. At right of the dotted line is the photosynthesis subcategory, shown on a different scale. The percentage of each category is compared with the whole genome, and hypergeometric test P values are shown above the bars. Arrowheads indicate significantly different categories (P < 0.01).
Figure 5.
Figure 5.
Comparison of ChIP-Chip Data with Genome-Wide Expression Analysis. (A) Experimental expression analysis of the hy5-221 mutant compared with Columbia wild type. A 2.7K 70mer microarray was used in this analysis. The total number represents the number of differentially expressed genes by twofold or greater (P < 0.05) in hy5-221. The white area represents the number of differentially expressed genes that also have HY5 binding sites and their percentage compared with total differentially expressed genes. (B) Relative proportion of upregulated and downregulated genes in hy5 that also have HY5 binding sites.
Figure 6.
Figure 6.
Comparison of ChIP-Chip Data with Organ-Specific Expression Profiles That Are Regulated by Light. (A) Venn diagram of the differentially expressed gene profiles in all tissues (cotyledon, hypocotyl, and root) (Ma et al., 2005) and ChIP-chip data. Numbers in the overlapping areas indicate the number of genes that exhibited twofold or greater differential expression in each organ and that have HY5 binding sites in their promoters. (B) Venn diagram of the differentially expressed (at least twofold at P < 0.05) gene profiles in all tissues (cotyledon, hypocotyl, and root) and ChIP-chip data. At left is a comparison of genes upregulated by light and HY5 binding targets, and at right is a comparison of genes downregulated by light and HY5 binding targets. (C) Percentage of HY5 binding targets among the genes expressed differentially by light in each organ analyzed in (B). (D) Hierarchical clustering display of white light–regulated genome expression among the three seedling organs. Horizontal black lines denote the presence of HY5 binding sites.
Figure 7.
Figure 7.
Comparison of the HY5 Binding Target Genes with the phyA- and phyB-Regulated Gene Expression Profiles Using the 8.2K Affymetrix Chip (Tepperman et al., 2001, 2004). (A) The percentage of HY5 binding targets is shown in dark blue in each gene group. (B) The percentage of HY5 binding targets in each subgroup is shown in dark blue in each circle. (C) and (D) The numbers of transcription factors of each subgroup are shown for Rc light–regulated (C) and FRc light–regulated (D).
Figure 8.
Figure 8.
HY5 Directly Regulates Photosynthesis-Related Genes. (A) ChIP-chip analysis shows enrichment of CAB1, CHS, and RbcS1A, which was confirmed by ChIP-PCR. Input control is shown at bottom. (B) Quantitative real-time PCR analysis confirms the ChIP-PCR results. The enrichment of the promoter regions of CAB1, CHS, RbcS1A, and F3H was confirmed by real-time PCR using the ChIP products from the wild type and HA:HY5. Values are normalized against wild-type values and are means of triplicate experiments with error bars representing sd. Negative control (At4g26900) data are shown at right. (C) RNA gel blot analysis in the wild type and hy5 after the dark-to-light transition. Seedlings were grown in the dark for 4 d, then transferred to white light (80 μmol·m−2·s−1). (D) RNA gel blot analysis in wild-type and hy5 seedlings grown under Wc light. (E) Accumulation rates of chlorophyll (top) and anthocyanin (bottom) after the dark-to-light transition. Wild-type (closed squares) and hy5 mutant (open circles) seedlings were grown in the dark for 4 d, then transferred to white light (closed circles); tissues were harvested at 0, 6, 12, and 24 h after transfer.
Figure 9.
Figure 9.
Effects of hy5 and the Light-to-Dark Transition on the Expression of Genes Encoding Circadian Regulators. Wild-type and hy5 plants were grown under continuous white light (L) for 4 d and transferred to darkness (D) for 8 h. The expression of genes for circadian regulators (CCA1, LHY, TOC1, ELF3, GI, and FKF1) and randomly selected HY5 target genes (At5g52020, At2g35930, At5g02270, At5g44110, and MYB12) among the genes downregulated by hy5 was detected by RT-PCR. Tubulin (TUB) was used as a quantitative control.

References

    1. Altschul, S.F., Madden, T.L., Schaffer, A.A., Zhang, J., Zhang, Z., Miller, W., and Lipman, D.J. (1997). Gapped BLAST and PSI-BLAST: A new generation of protein database search programs. Nucleic Acids Res. 25 3389–3402. - PMC - PubMed
    1. Anderson, S.L., Somers, D.E., Millar, A.J., Hanson, K., Chory, J., and Kay, S.A. (1997). Multiple genetically defined phototransduction pathways interact with circadian clock signals to regulate CAB2 transcription. Plant Cell 9 1727–1743. - PMC - PubMed
    1. Ang, L.H., Chattopadhyay, S., Wei, N., Oyama, T., Okada, K., Batschauer, A., and Deng, X.W. (1998). Molecular interaction between COP1 and HY5 defines a regulatory switch for light control of Arabidopsis development. Mol. Cell 1 213–222. - PubMed
    1. Arabidopsis Genome Initiative (2000). Analysis of the genome sequence of the flowering plant Arabidopsis thaliana. Nature 408 796–815. - PubMed
    1. Benjamini, Y., and Hochberg, Y. (1995). Controlling the false discovery rate: A practical and powerful approach to multiple testing. J. R. Stat. Soc. B 57 289–300.

Publication types

MeSH terms

Associated data