. 2007 Mar;19(3):986-1006.
doi: 10.1105/tpc.106.047407. Epub 2007 Mar 2.

PIC1, an ancient permease in Arabidopsis chloroplasts, mediates iron transport

Affiliations

PIC1, an ancient permease in Arabidopsis chloroplasts, mediates iron transport

Daniela Duy et al. Plant Cell. 2007 Mar.

Abstract

In chloroplasts, the transition metals iron and copper play an essential role in photosynthetic electron transport and act as cofactors for superoxide dismutases. Iron is essential for chlorophyll biosynthesis, and ferritin clusters in plastids store iron during germination, development, and iron stress. Thus, plastidic homeostasis of transition metals, in particular of iron, is crucial for chloroplast as well as plant development. However, very little is known about iron uptake by chloroplasts. Arabidopsis thaliana PERMEASE IN CHLOROPLASTS1 (PIC1), identified in a screen for metal transporters in plastids, contains four predicted alpha-helices, is targeted to the inner envelope, and displays homology with cyanobacterial permease-like proteins. Knockout mutants of PIC1 grew only heterotrophically and were characterized by a chlorotic and dwarfish phenotype reminiscent of iron-deficient plants. Ultrastructural analysis of plastids revealed severely impaired chloroplast development and a striking increase in ferritin clusters. Besides upregulation of ferritin, pic1 mutants showed differential regulation of genes and proteins related to iron stress or transport, photosynthesis, and Fe-S cluster biogenesis. Furthermore, PIC1 and its cyanobacterial homolog mediated iron accumulation in an iron uptake-defective yeast mutant. These observations suggest that PIC1 functions in iron transport across the inner envelope of chloroplasts and hence in cellular metal homeostasis.


Figures

Figure 1.
Figure 1.
PIC1 Is a Permease of Cyanobacterial Origin with Four α-Helical Transmembrane Domains. (A) Phylogenetic tree of the PIC family in eukaryotes and cyanobacteria. In plants, At-PIC1 groups into a family of homologous proteins from monocots such as rice (Os-PIC1 and Os-PIC2) and maize (Zm-PIC1 and Zm-PIC2). The closest relative to At-PIC1 is found in the dicotyledonous plant Lotus japonicus (Lj-PIC1), whereas the homolog from the moss Physcomitrella patens (Pp-PIC1) is more distantly related. In the genomes of the green alga Chlamydomonas reinhardtii as well as the red alga Cyanidioschyzon merolae, we could identify homologs to At-PIC1. Cyanobacterial relatives to At-PIC1 from Synechocystis sp PCC 6803 (sll1656), Anabena sp PCC 7120 (all4113), Thermosynechococcus elongatus BP-1 (tll0396), and Prochlorococcus marinus strain MIT 9313 (PMT0365) are depicted. All proteins were identified by BLAST screening of At-PIC1 against the respective databases (see Methods). The distance tree is based on 148 amino acids of the predicted mature proteins (see Methods and Supplemental Figure 1 online). Bootstrap values for the respective branches are indicated. (B) Predicted topology for PIC1. According to the AM consensus prediction (ARAMEMNON database; Schwacke et al., 2003), four α-helical transmembrane domains are proposed for At-PIC1 as well as for the homologs Os-PIC1, Os-PIC2, sll1656, and all4113. CT, C terminus; NT, N terminus. (C) Sequence alignment of At-PIC1 with its closest relatives from plants (Lj-PIC1; 74% amino acid identity of mature proteins) and cyanobacteria (sll1656 and all4113; 24 and 23% amino acid identity of mature proteins, respectively). Amino acids identical in all four proteins are shown as black-boxed letters, and residues conserved in two or three sequences are shown as gray-boxed letters. The predicted four transmembrane domains of At-PIC1 are boxed, and the potential cleavage site of the chloroplast transit peptide is indicated by a black arrowhead.
Figure 2.
Figure 2.
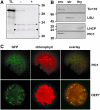
Subcellular Localization of PIC1 to the Inner Envelope of Chloroplasts. (A) In vitro import of PIC1 into chloroplasts isolated from cotyledons of 8-d-old Col-0 seedlings. Purified intact chloroplasts equivalent to 10 μg of chlorophyll were incubated for 15 min at 25°C with the in vitro–translated 35S-labeled PIC1 precursor protein (TL). After the import reaction, chloroplasts were either not treated (−) or treated (+) with the protease thermolysin for 30 min at 4°C. Intact chloroplasts were recovered by centrifugation, and import products were analyzed by SDS-PAGE and autoradiography. The precursor protein PIC1 is processed to a mature protein of 22 kD (arrowheads). The mature protein as well as an intermediate form of 23.5 kD (asterisks) are protease-protected, confirming import into intact chloroplasts. The translation mixture sample (TL) represents 10% of the precursor added to the import reaction. (B) Immunoblot analysis of PIC1 localization in chloroplast subfractions. Chloroplasts from 6-week-old Arabidopsis rosette leaves were fractionated into envelopes (env), stroma (str), and thylakoid membranes (thy), as described in Methods. Equal amounts of proteins from the subfractions were separated by SDS-PAGE and subjected to immunoblot analysis using an antibody directed against the C-terminal part of At-PIC1. The α-PIC1 stain gave a single band of ∼22 kD in chloroplast envelopes only. Antisera against the marker proteins Ps-Tic110 (inner envelope), Ps-LSU (stroma), and Ps-LHCP (thylakoid membranes) were used as controls. Numbers at left indicate the molecular mass of proteins in kilodaltons. (C) Subcellular localization of PIC1-GFP fusion proteins. Arabidopsis mesophyll protoplasts were transiently transformed with constructs for PIC1-GFP and OEP7-GFP. Images are shown for GFP fluorescence, chlorophyll autofluorescence, and an overlay of both. PIC1-GFP signals were localized in a spotted pattern to the periphery of chloroplasts. OEP7-GFP, included as a marker for the chloroplast outer envelope, gave more evenly distributed GFP fluorescence around the chloroplasts.
Figure 3.
Figure 3.
Gene Expression of PIC1 Peaks in Green Tissues. (A) Expression profile of PIC1 in leaves and roots of 4-week-old Arabidopsis plants. Microarray signals (Affymetrix GeneChip Arabidopsis ATH1) are made comparable by scaling the average overall signal intensity of all probe sets to a target signal of 100 (arbitrary units). The average scaled signals (±se) of three independent experiments are shown. (B) Quantification of PIC1 mRNA by quantitative real-time RT-PCR in 7-d-old Arabidopsis seedlings. Left, the transcript content in whole seedlings is displayed relative to 10,000 transcripts of actin 2/8 (n = 4; ±sd). Right, when seedlings were separated into cotyledons and roots, the PIC1 mRNA in roots was only 21 ± 9% of that in cotyledons. The transcript content was quantified relative to actin 2/8 mRNA (n = 3; ±sd) and normalized to the amount in cotyledons, which was set to 100%. Please note that the y axis is divided into two different scales for PIC1 transcripts/10,000 actin transcripts (left) and PIC1 transcripts in percentage (right). (C) In silico transcriptional profiling of PIC1 expression (arbitrary units) during plant development. Data used to create the in silico transcriptional profiles were obtained from AtGenExpress experiments (Schmid et al., 2005). Signal intensities were averaged from three technical replicates ± sd. c, cotyledons of 7-d-old plants; l, first and second leaves of 7-d-old plants; rl2 to rl12, rosette leaves 2, 4, 6, 8, 10, and 12 of 17-d-old plants; cl, cauline leaves of 21-d-old plants; sl, senescing leaves of 35-d-old plants; hy, hypocotyls of 7-d-old plants; sa, shoot of apex 7-d-old plants; r7, roots of 7-d-old plants; r17, roots of 17-d-old plants.
Figure 4.
Figure 4.
Characterization of pic1 Mutant Alleles. (A) Diagram of the genomic organization of PIC1 and positions of identified T-DNA insertions. The PIC1 gene is 1704 bp long and comprises four exons (black arrows). The consecutive numbering of the gene starts with the predicted transcriptional start, located behind a potential TATA box (black bar). In consequence, PIC1 has a 5′ UTR of 206 bp and an annotated 186-bp 3′ UTR (National Center for Biotechnology Information reference sequence NM_127089). In three independent T-DNA insertion lines, the T-DNA has inserted into different parts of exon 1 (pic1-1 and pic1-2) and into the putative promoter region (position −430; pic1-3). ROK2, T-DNA present in the SALK collection (SALK_104852); AC161 and AC106, T-DNA present in the GABI-Kat lines 577D06 and 804F07, respectively. Positions and directions of left border T-DNA sequences (LB) and of gene-specific oligonucleotide primers used for PCR genotyping of pic1 mutants (04fw, 04rev, 52fw, 52rev, 77fw, and 77rev) and for RT-PCR (pic1,2fw, pic1,2rev, LCfw, and LCrev) are depicted. (B) The T-DNA in pic1-1 and pic1-2 interrupts the open reading frame of PIC1. In pic1-1, the T-DNA ROK2 has inserted at position 214 of the PIC1 gene, interrupting the open reading frame behind amino acid 2. In pic1-2, the AC161 T-DNA blocks translation after amino acid 37 of exon 1 (position 320 of PIC1). Please note that behind the T-DNA insertion site, we identified a deletion of 28 bp (boxed letters) in the PIC1 coding region. (C) Homozygous mutations in pic1-1 and pic1-2 result in loss of full-length PIC1 transcripts. Top graph, quantification of PIC1 transcripts in 7-d-old seedlings of Col-0 wild type and homozygous pic1-1, pic1-2, and pic1-3 mutant lines. Transcript density was measured by quantitative real-time RT-PCR with the primer pair LCfw-rev (see [A]) as described in Methods. The PIC1 mRNA content (n = 3; ±sd) was calculated relative to actin 2/8 transcripts and normalized to the amount in Col-0 seedlings, which was set to 100% (arbitrary units). Whereas in pic1-1/pic1-1 and pic1-2/pic1-2 the mRNA level was ∼10% of wild-type RNA (white bars), pic1-3/pic1-3 seedlings contained 34 ± 8.4% of Col-0 PIC1 mRNA (black bars). Bottom panel, RT-PCR experiments with pic1,2fw-rev primers (see [A]), which flank the T-DNA insertion sites of pic1-1 and pic1-2 mutant alleles. PCR was performed on cDNA of 7-d-old seedlings from Col-0 as well as from homozygous pic1-1, pic1-2, and pic1-3 (ho) and the corresponding wild-type alleles PIC1-1/PIC1-1, PIC1-2/PIC1-2, and PIC1-3/PIC1-3 (wt). Please note that the primer pair pic1,2fw-rev was not able to amplify a specific product (343 bp) on homozygous pic1-1 and pic1-2 mutants, indicating that these alleles lack full-length PIC1 transcripts. In turn, the 10% residual RNA detected by quantitative RT-PCR with C-terminal primers (top graph) most likely resulted from incomplete mRNA.
Figure 5.
Figure 5.
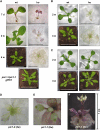
Loss of PIC1 Generates Chlorotic and Dwarfed Mutant Plants. The phenotypes of homozygous pic1 mutants (ho) and the corresponding wild-type alleles (wt) are depicted. The age of the plants is given in days (d) or weeks (w). Homozygous plants of pic1-1 and pic1-2 mutants were grown on MS agar medium supplemented with 1% sucrose. If not indicated otherwise, black bars = 0.5 cm and white bars = 5.0 cm. (A) Homozygous pic1-1 mutants are dwarfed and chlorotic. Cotyledons in 7-d-old seedlings of homozygous pic1-1/pic1-1 (ho) are red. The first leaves after 2 weeks are transparent, and so is the fully grown rosette in the dwarfed plants after 4 weeks of growth. Please note that the shoot meristem of pic1-1/pic1-1 is pale green (cf. [B] and [D]). In pic1-1/pic1-1 gPIC1 (T2 generation, 4 weeks old), the loss of PIC1 has been fully complemented by transformation of the mutant with the PIC1 gene (see Methods). (B) pic1-2/pic1-2 plants display the same phenotype described for pic1-1/pic1-1 in (A). (C) The residual 35% of fully transcribed PIC1 mRNA in homozygous pic1-3 mutants (see Figure 3C) is enough to produce mutant plants with wild-type appearance. (D) Close-up of shoot apex and young leaves of a homozygous pic1-2 mutant plant (4 weeks old). Meristem and young leaves of the mutant are pale green, whereas older leaves become chlorotic during development and growth. (E) Close-up of developing inflorescence of a homozygous pic1-1 mutant plant (6 weeks old). Young sepals and the style of the flower are pale green. (F) Fully developed homozygous pic1-1 mutant after 8 weeks of growth. The sepals of the flower have turned white, the styles and developing siliques are pale green, and the rosette leaves and the stem of the plant are red.
Figure 6.
Figure 6.
Leaf Morphology Is Changed in pic1-1 Mutant Plants. (A) and (B) Rosette leaves from 4-week-old Col-0 wild-type (A) and homozygous pic1-1 mutant (B) plants. Leaves of pic1-1/pic1-1 are reduced in size, and the diameter of primary, secondary, and tertiary veins is not graduated, as in the wild type. Before photography, leaves were destained in 70% ethanol. (C) to (F) Semithin cross sections of rosette leaves from 17-d-old Col-0 wild-type (C) and pic1-1/pic1-1 (D) as well as from 7-d-old cotyledons of Col-0 (E) and homozygous pic1-1 (F). In pic1-1/pic1-1 mutants, the organization of the leaf mesophyll into palisade and spongy parenchyma cells is lost (D). Furthermore, the leaf surface is extremely curled, and inside the cells no chloroplasts are visible ([D] and [F]). (G) and (H) Transmission electron micrographs of cortex cells from 7-d-old cotyledons of Col-0 (G) and pic1-1/pic1-1 (H) seedlings. Please note that the cotyledon cells in homozygous pic1-1 plants do not contain correctly developed chloroplasts (H).
Figure 7.
Figure 7.
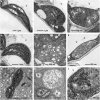
Chloroplast Development in pic1-1/pic1-1 Is Impaired, and Mutant Plastids Accumulate Ferritin. Chloroplast ultrastructure was monitored by transmission electron microscopy. Plastoglobules were present in plastids of mutant and wild-type plants at all developmental stages. M, mitochondria; S, starch grains; V, vacuoles. (A) to (C) Plastids from 7-d-old cotyledons. (A) shows a control chloroplast (Col-0 wild type) containing grana and stroma thylakoids, starch grains, and plastoglobules. By contrast, plastids of the mutant pic1-1/pic1-1 are about half the size and contain only inchoate ([B], white arrowhead) or no (C) thylakoids. (D) to (F) Chloroplasts in 17-d-old rosette leaves of Col-0 (D) and pic1-1/pic1-1 ([E] and [F]). Two types of plastids were present in rosette leaves of homozygous pic1-1: plastids characterized by the formation of membrane vesicles (asterisks) in the stroma (E), and plastids without thylakoids (F). (G) and (H) Proplastids in the shoot apex of 17-d-old plants. In the differentiating meristem of Col-0 wild-type plants (G), proplastids were characterized by developing thylakoid systems (white arrowhead). The shoot apex of pic1-1/pic1-1 (H) contains proplastids with developing thylakoids (white arrowhead) as well as without thylakoids and less electron-dense matrix (organelle at top right) in the same cell. In pic1-1 mutant plastids, phytoferritin clusters (white circles) are visible. (I) Ferritin cluster typical for plastids of cotyledons from 7-d-old pic1-1/pic1-1.
Figure 8.
Figure 8.
Immunoblot Analysis of pic1 Mutants and Wild-Type Plants. Fifty micrograms of total protein, extracted from leaves of 4-week-old homozygous pic1-1 and pic1-2 mutants and Col-0 wild-type plants, were subjected to immunoblot analysis. Numbers at left indicate the molecular mass in kilodaltons, and asterisks indicate the molecular mass of the respective precursor proteins. Except for RBCS (tobacco [Nicotiana tabacum]), VIPP1 (pea), and PSBO-1 (spinach [Spinacia oleracea]), all antisera are directed against Arabidopsis proteins. Below, the molecular mass in kilodaltons of the respective precursor (pre) and mature (mat) forms of all proteins is indicated, and the chloroplast localization is specified. For Arabidopsis Genome Initiative codes of Arabidopsis proteins, see Table 1. (A) Proteins related to metal homeostasis are differentially regulated, whereas proteins associated with photosynthesis and carbon fixation are absent in pic1 mutants. Antisera against the following proteins were used: FER (ferritin; 28 pre, 23.5 mat, stroma), CSD1 (cytosolic copper superoxide dismutase; 15 kD), CSD2 (plastidic CSD; 22 pre, 18 mat, stroma), FSD1 (plastidic iron superoxide dismutase; 24 pre, 23 mat, stroma), LHCB4 (chlorophyll binding protein B4; 31 pre, 27 mat, attached to thylakoids), RBCS (small subunit of ribulose-1,5-bis-phosphate carboxylase/oxygenase; 20.2 pre, 14 mat, stroma), and OEP16.1 (outer envelope protein in chloroplasts of 16 kD). Please note that the FER antibody detects the ferritin protein family in Arabidopsis (FER1 to FER4) and LHCB4 reacts with the proteins LHCB4.1, -4.2, and -4.3 (see Table 1). (B) Chloroplast-localized proteins are properly imported into pic1 mutant plastids and processed to their mature size. Antisera against the following proteins were used: VIPP1 (vesicle-inducing protein in plastids; 43 pre, 36 mat, inner envelope), PORB (protochlorophyllide oxidoreductase B; 43 pre, 36 mat, stroma), and PSBO-1 (33-kD subunit of the oxygen-evolving complex; 40.5 pre, 33 mat, thylakoid lumen). TL, in vitro translation product of the precursor PORB. Please note that the PORB antibody detects PORB and PORC, both of which are decreased in pic1 mutant leaves (see Table1).
Figure 9.
Figure 9.
PIC1 and Its Synechocystis Homolog sll1656 Are Able to Complement the Growth of Metal Uptake–Defective Yeast Mutants. The plasmid pFL61 (empty vector control) as well as the cDNA of IRT1, PIC1, and sll1656 in pFL61 were introduced into the fet3 fet4 (A) and ctr1 (B) yeast mutants. Serial dilutions with an OD600 of 10−1, 10−2, and 5 × 10⁻³ of rapidly growing yeast cells were dotted on SC (−uracil) minimal medium, pH 5.0, supplemented with different concentrations of FeCl3 or EDTA as indicated. The growth of yeast cells was documented after 2 d on the plate. (A) PIC1 and sll1656 are able to restore the growth of fet3 fet4 in the concentration range 5 to 10 μM FeCl3. IRT1-complemented fet3 fet4 cells are able to grow without additional iron, whereas dilutions of the empty vector–containing cells (pFL61) need 20 μM FeCl3 to grow. (B) With 0.1 and 0.5 mM EDTA in the medium, PIC1, sll1656, and IRT1 are still able to restore the growth of the yeast mutant ctr1. By contrast, cells transfected with the empty vector pFL61 grow poorly on 0.1 mM EDTA and fail to grow with 0.5 mM EDTA in the medium.

References

    1. Abdel-Ghany, S.E., Muller-Moule, P., Niyogi, K.K., Pilon, M., and Shikanai, T. (2005). Two P-type ATPases are required for copper delivery in Arabidopsis thaliana chloroplasts. Plant Cell 17 1233–1251. - PMC - PubMed
    1. Alonso, J.M., Stepanova, A.N., Leisse, T.J., Kim, C.J., Chen, H., Shinn, P., Stevenson, D.K., Zimmerman, J., Barajas, P., Cheuk, R., and Heller, C. (2003). Genome-wide insertional mutagenesis of Arabidopsis thaliana. Science 301 653–657. - PubMed
    1. Altschul, S.F., Madden, T.L., Schaffer, A.A., Zhang, J., Zhang, Z., Miller, W., and Lipman, D.J. (1997). Gapped BLAST and PSI-BLAST: A new generation of protein database search programs. Nucleic Acids Res. 25 3389–3402. - PMC - PubMed
    1. Aronsson, H., and Jarvis, P. (2002). A simple method for isolating import-competent Arabidopsis chloroplasts. FEBS Lett. 529 215–220. - PubMed
    1. Asada, K. (1999). The water-water cycle in chloroplasts: Scavenging of active oxygen and dissipation of excess photons. Annu. Rev. Plant Physiol. Plant Mol. Biol. 50 601–639. - PubMed

Publication types

MeSH terms