

Development and prospective evaluation of an automated software system for quality control of quantitative 99mTc-MAG3 renal studies
- PMID: 17337654
- PMCID: PMC3205090
Development and prospective evaluation of an automated software system for quality control of quantitative 99mTc-MAG3 renal studies
Abstract
Quantitative nuclear renography has numerous potential sources of error. We previously reported the initial development of a computer software module for comprehensively addressing the issue of quality control (QC) in the analysis of radionuclide renal images. The objective of this study was to prospectively test the QC software.
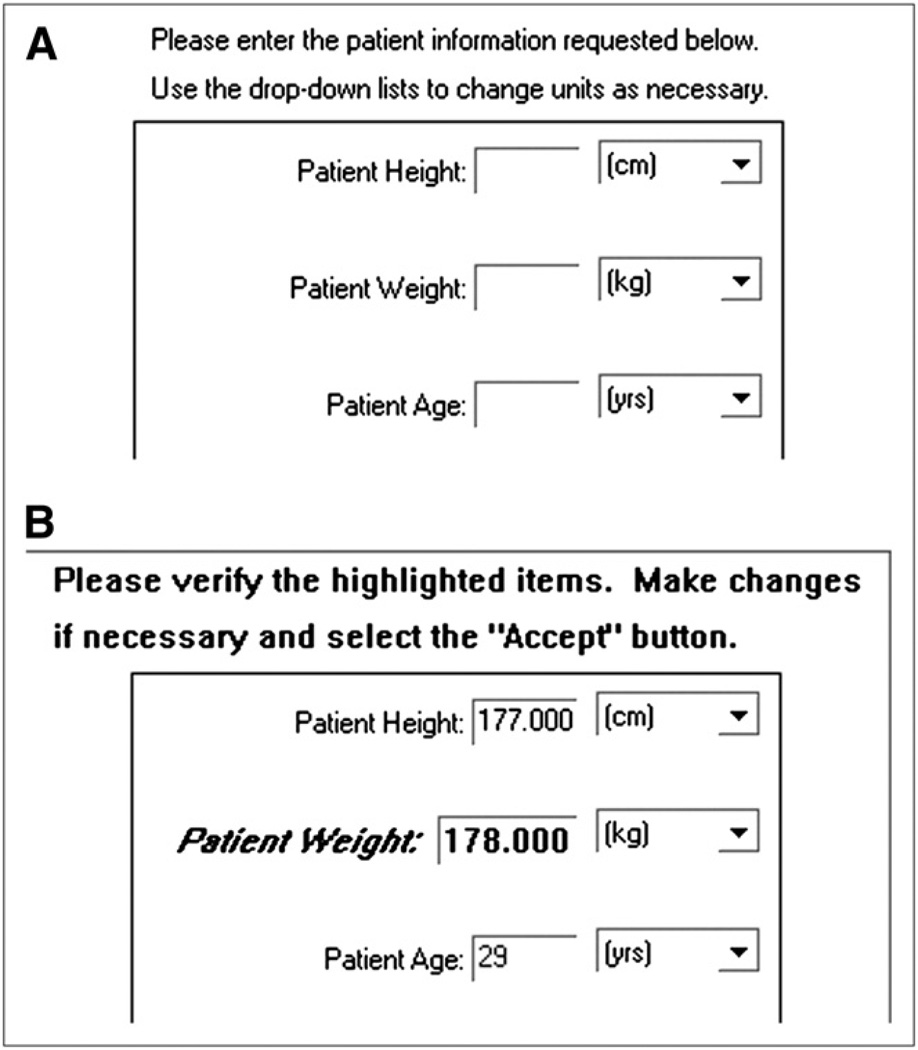
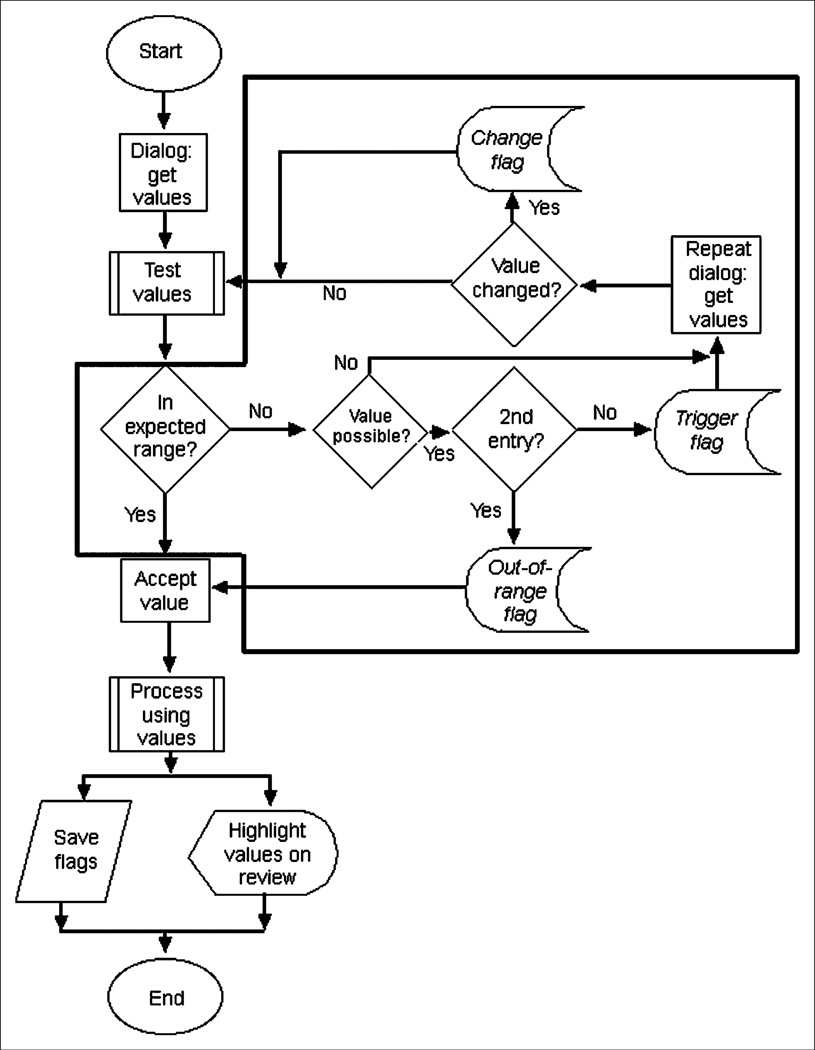
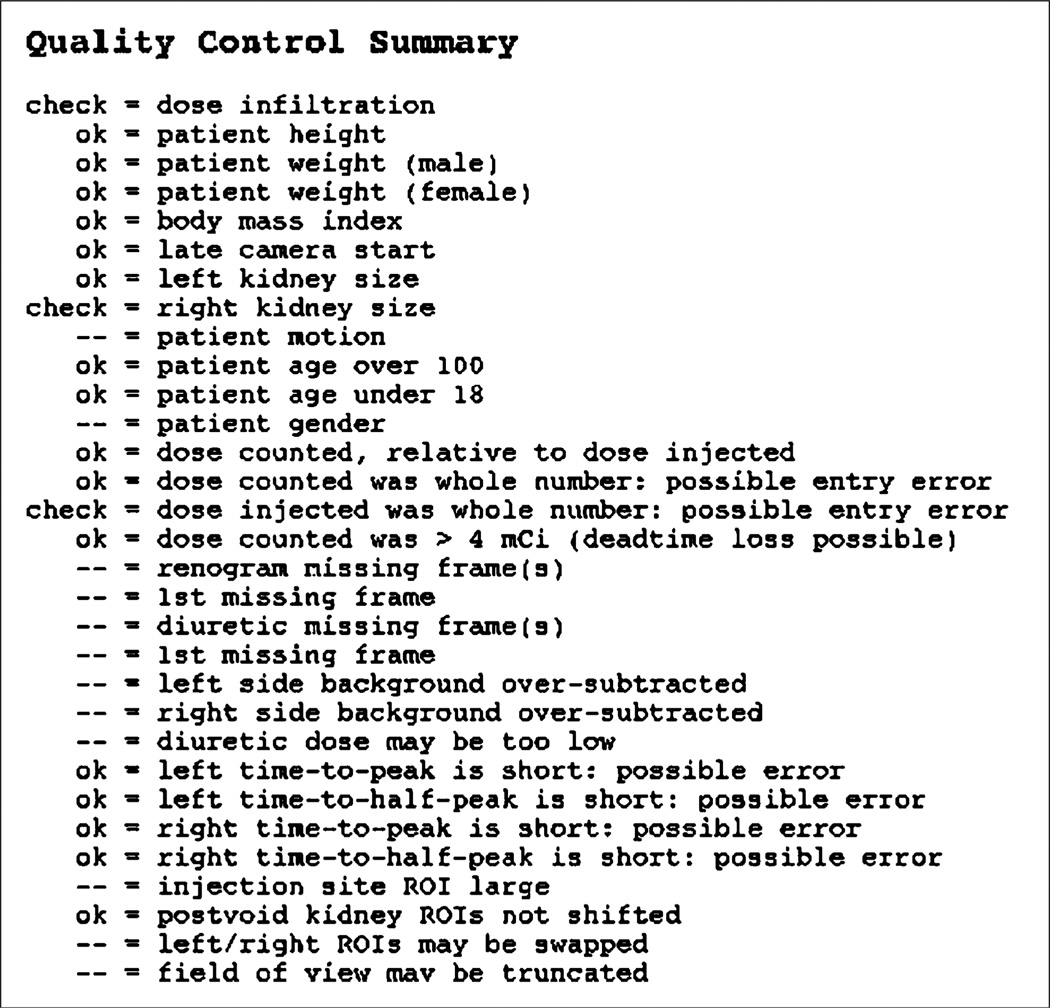
Methods: The QC software works in conjunction with standard quantitative renal image analysis using a renal quantification program. The software saves a text file that summarizes QC findings as possible errors in user-entered values, calculated values that may be unreliable because of the patient's clinical condition, and problems relating to acquisition or processing. To test the QC software, a technologist not involved in software development processed 83 consecutive nontransplant clinical studies. The QC findings of the software were then tabulated. QC events were defined as technical (study descriptors that were out of range or were entered and then changed, unusually sized or positioned regions of interest, or missing frames in the dynamic image set) or clinical (calculated functional values judged to be erroneous or unreliable).
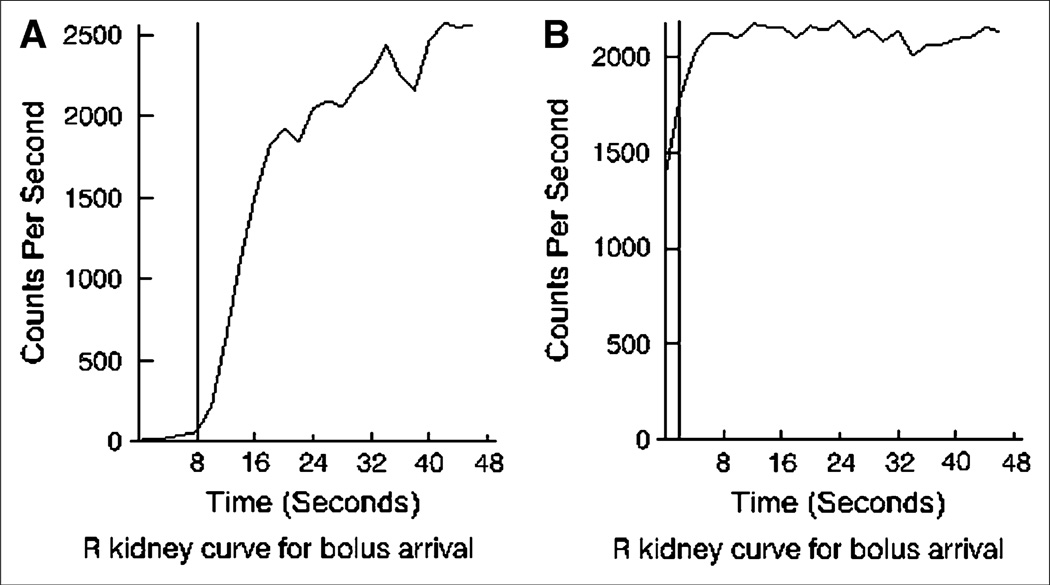
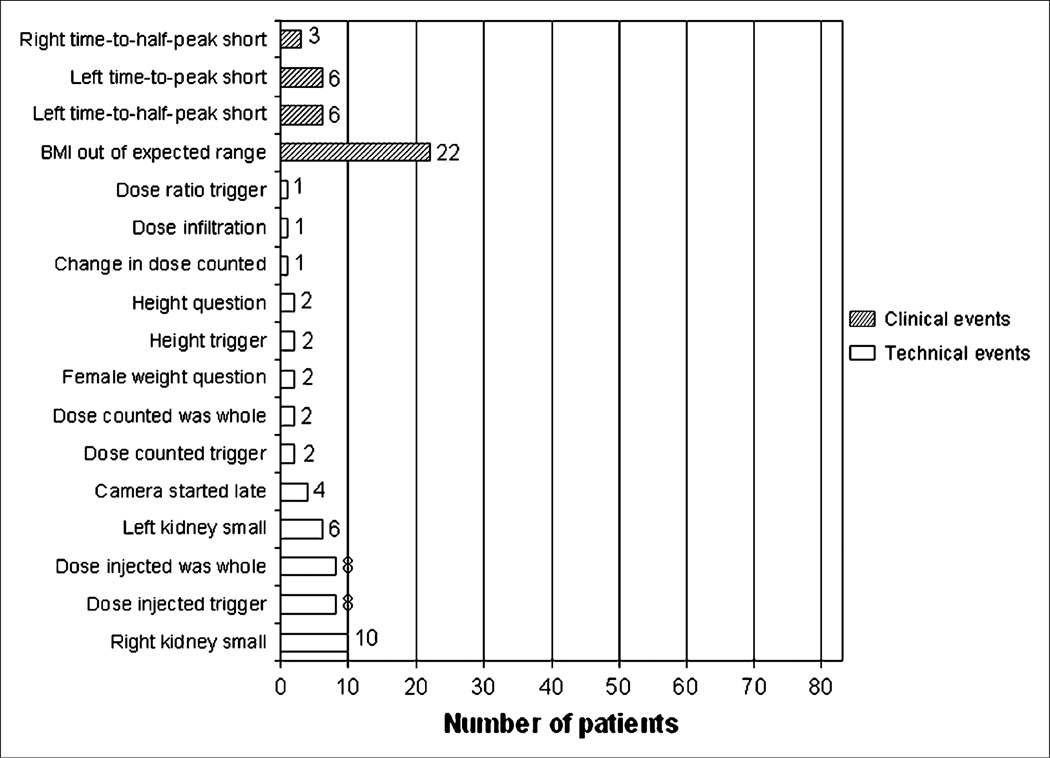
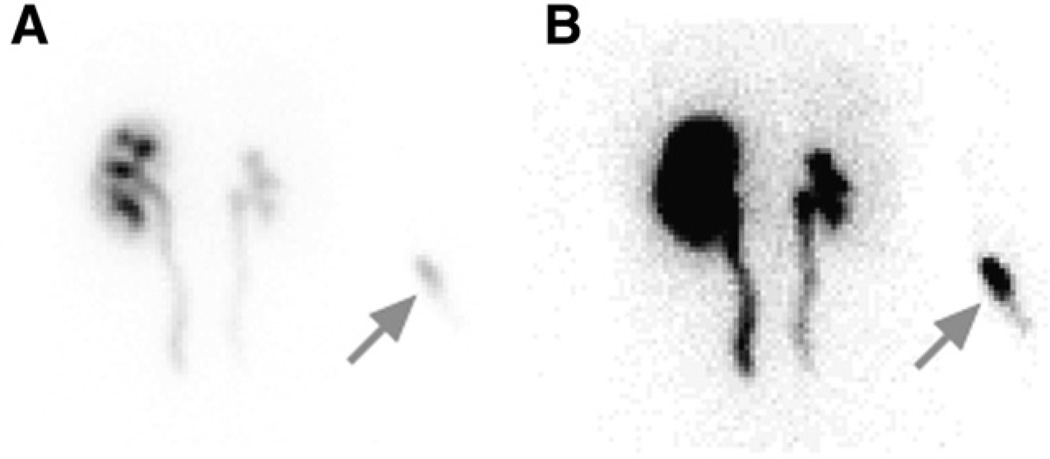
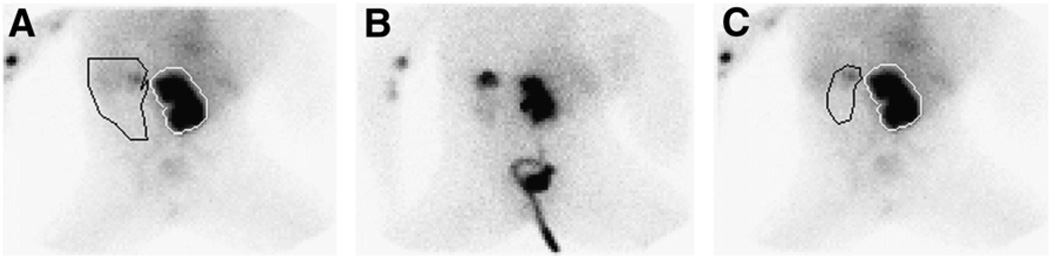
Results: Technical QC events were identified in 36 (43%) of 83 studies. Clinical QC events were identified in 37 (45%) of 83 studies. Specific QC events included starting the camera after the bolus had reached the kidney, dose infiltration, oversubtraction of background activity, and missing frames in the dynamic image set.
Conclusion: QC software has been developed to automatically verify user input, monitor calculation of renal functional parameters, summarize QC findings, and flag potentially unreliable values for the nuclear medicine physician. Incorporation of automated QC features into commercial or local renal software can reduce errors and improve technologist performance and should improve the efficiency and accuracy of image interpretation.
Conflict of interest statement
The terms of this arrangement have been reviewed and approved by Emory University in accordance with its conflict-of-interest practice.
Figures
References
-
- Kohn LT, Corrigan JM, Donaldson MS. To Err Is Human: Building a Safer Health System. Washington, D.C.: National Academy Press; 2000. - PubMed
-
- Leape LL, Berwick DM. Five years after To Err Is Human: what have we learned? JAMA. 2005;293:2384–2390. - PubMed
-
- Strauss BS, Blaufox MD. Estimation of residual urine and urine flow rates without urethral catheterization. J Nucl Med. 1970;11:81–84. - PubMed
-
- Gordon I, Mialdea-Fernandez RM, Peters AM. Pelviureteric junction obstruction: the value of a post-micturition view in 99mTc DTPA diuretic renography. Br J Urol. 1988;61:409–412. - PubMed
-
- Bubeck B. Renal clearance determination with one blood sample: improved accuracy and universal applicability by a new calculation principle. Semin Nucl Med. 1993;23:73–86. - PubMed
Publication types
MeSH terms
Substances
Grants and funding
LinkOut - more resources
Full Text Sources
Medical