. 2007 Mar 5:8:73.
doi: 10.1186/1471-2105-8-73.

Structural and evolutionary bioinformatics of the SPOUT superfamily of methyltransferases

Affiliations

Structural and evolutionary bioinformatics of the SPOUT superfamily of methyltransferases

Karolina L Tkaczuk et al. BMC Bioinformatics. .

Abstract

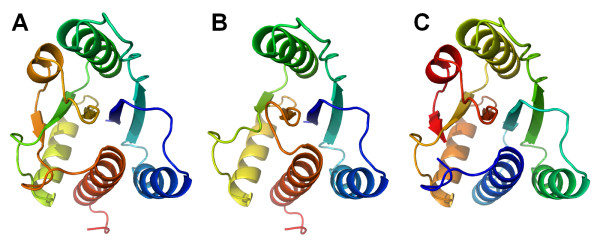
Background: SPOUT methyltransferases (MTases) are a large class of S-adenosyl-L-methionine-dependent enzymes that exhibit an unusual alpha/beta fold with a very deep topological knot. In 2001, when no crystal structures were available for any of these proteins, Anantharaman, Koonin, and Aravind identified homology between SpoU and TrmD MTases and defined the SPOUT superfamily. Since then, multiple crystal structures of knotted MTases have been solved and numerous new homologous sequences appeared in the databases. However, no comprehensive comparative analysis of these proteins has been carried out to classify them based on structural and evolutionary criteria and to guide functional predictions.

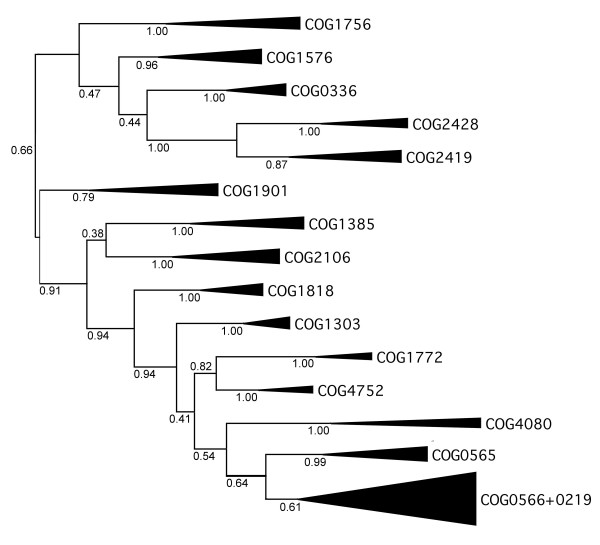
Results: We carried out extensive searches of databases of protein structures and sequences to collect all members of previously identified SPOUT MTases, and to identify previously unknown homologs. Based on sequence clustering, characterization of domain architecture, structure predictions and sequence/structure comparisons, we re-defined families within the SPOUT superfamily and predicted putative active sites and biochemical functions for the so far uncharacterized members. We have also delineated the common core of SPOUT MTases and inferred a multiple sequence alignment for the conserved knot region, from which we calculated the phylogenetic tree of the superfamily. We have also studied phylogenetic distribution of different families, and used this information to infer the evolutionary history of the SPOUT superfamily.

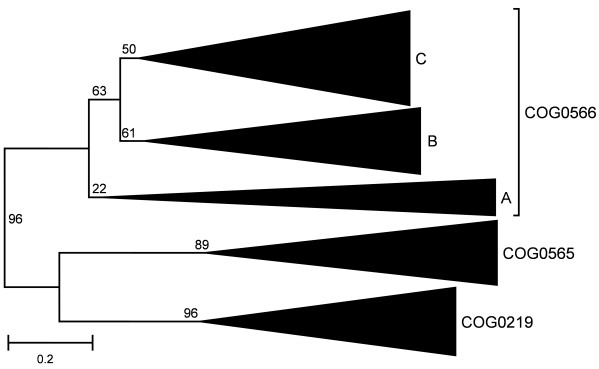
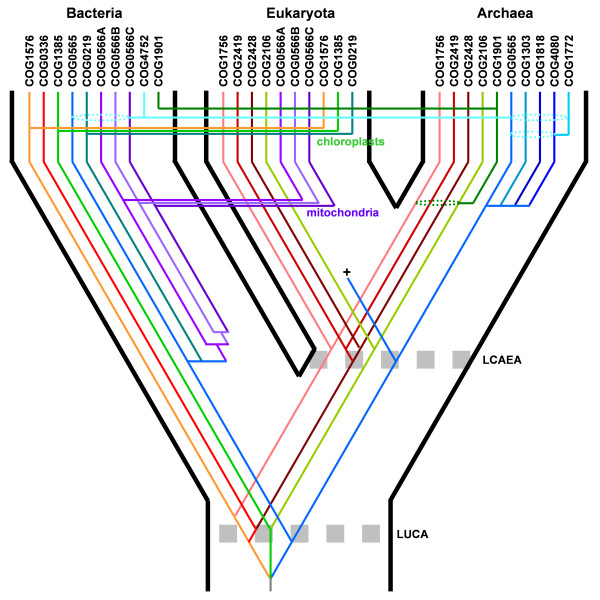
Conclusion: We present the first phylogenetic tree of the SPOUT superfamily since it was defined, together with a new scheme for its classification, and discussion about conservation of sequence and structure in different families, and their functional implications. We identified four protein families as new members of the SPOUT superfamily. Three of these families are functionally uncharacterized (COG1772, COG1901, and COG4080), and one (COG1756 represented by Nep1p) has been already implicated in RNA metabolism, but its biochemical function has been unknown. Based on the inference of orthologous and paralogous relationships between all SPOUT families we propose that the Last Universal Common Ancestor (LUCA) of all extant organisms contained at least three SPOUT members, ancestors of contemporary RNA MTases that carry out m1G, m3U, and 2'O-ribose methylation, respectively. In this work we also speculate on the origin of the knot and propose possible 'unknotted' ancestors. The results of our analysis provide a comprehensive 'roadmap' for experimental characterization of SPOUT MTases and interpretation of functional studies in the light of sequence-structure relationships.


Figures

Figure 1
Figure 1
Conserved topology of the common core and the most typical architecture of the active site in SPOUT proteins, exemplified by a 'minimal' putative MTase SAV0024 (1vh0), RlmB (1gz0), and TrmD (1p9p). Helices are shown as circles, strands are shown as triangles. Universally conserved elements are shown in grey, variable elements are in white.
Figure 2
Figure 2
'Perpendicular' and 'antiparallel' modes of dimerization observed among SPOUT enzymes, exemplified by TrmH (1v2x, left) and TrmD (1p9p, right). One monomer (indicated in green, shown on the top) is shown in the same orientation in both proteins, while the other one (indicated in blue, shown on the bottom) is rotated by about 90 degrees (TrmH) or 180 degrees (TrmD) with respect to the first one.
Figure 3
Figure 3
Domain architectures observed in the SPOUT superfamily. Light blue blocks indicate the common catalytic domain. Other known domains are shown in different colors. Uncharacterized extensions, which may or may not form independent domains, are indicated as white boxes with the corresponding patterns of predicted secondary structure (α helices and β strands). In the example shown at the bottom, a protein comprising two SPOUT domains from different families is shown.
Figure 4
Figure 4
Two-dimensional projection of the CLANS clustering results obtained for the full-length SPOUT sequences. Proteins are indicated by dots, colored according to the membership in different families (COGs). Lines indicate sequence similarity detectable with BLAST and are colored by a spectrum of shades of grey according to the BLAST P-value (black: P-value < 10-200, light grey: P-value < 10-5). Significant differences in the size of families could distort the results of clustering. Thus, for all families of size >50 we used the PURGE option of the Gibbs motif sampler [84] to identify 50 representative sequences with the maximal sequence divergence. However, the results of CLANS analyses for this 'representative' set of SPOUT members were very similar to those obtained for the full dataset (data not shown).
Figure 5
Figure 5
Two-dimensional projection of the CLANS clustering results obtained for the full-length sequences of the 'supercluster'. Proteins are indicated by colors according to their membership in families and subfamilies. Lines indicate sequence similarity detectable with BLAST and are colored by a spectrum of shades of grey according to the BLAST P-value (black: P-value < 10-45, light grey: P-value < 10-5).
Figure 6
Figure 6
Phyletic patterns of SPOUT families analyzed in this work, analyzed with respect to the fully sequenced genomes of organisms from the tree Domains of Life. Full squares correspond to taxons, where at least 50% of fully sequenced genomes contained the member of a given COG. Note that taxons comprise different numbers of representatives, e.g. Thermotogales contain only one species, Thermotoga maritima. For taxons with more than one fully sequenced genome, the presence of a COG member in less than 50% of genomes is indicated by an empty square, and the presence of just a single member is indicated by a dotted square.
Figure 7
Figure 7
Multiple sequence alignment of selected representatives of SPOUT COGs. Sequences are denoted by the COG number, species' name, the NCBI gene identification (GI) number and the PDB code (if applicable). The variable termini and non-conserved insertions are not shown; the number of omitted residues is indicated in parentheses. Amino acids are colored according to the physico-chemical properties of their side-chains (negatively charged: red, positively charged: blue, polar: green, hydrophobic: grey). The consensus secondary structure is shown above the alignment as tubes (helices) and arrows (strands). The most typical positions of AdoMet-binding residues are indicated above the alignment by vertical red arrows, while the typical positions of catalytic residues are indicated by blue arrows. Note that additional catalytic residues may be present in the N-terminal part (unalignable and therefore not shown in this figure) and that the position of catalytic residues varies between families, e.g. it depends on the mode of dimerization.
Figure 8
Figure 8
Conventional sequence-based Bayesian tree of SPOUT MTases calculated based on the sequence alignment in Figure 7. Triangles labeled with COG names indicate monophyletic families. All branches are labeled with their posterior probabilities. Although the monophyly of all individual COGs and some groups of COGs is well supported, the supports of deep branches is poor (<0.5).
Figure 9
Figure 9
Bayesian tree of SPOUT COGs based on the feature character matrix in Table 2. All branches are labeled with their posterior probabilities. Although the overall topology of the tree is similar to that of the sequence-based tree, features provide significant support only for a few lineages.
Figure 10
Figure 10
The unified Bayesian tree of SPOUT MTases calculated based on the sequence alignment in Figure 7 and the character matrix in Table 2. All branches are labeled with their posterior probabilities. Compared to the sequence-only tree, this tree shows improved support for deep branches and comparable support for terminal branches.
Figure 11
Figure 11
Minimum evolution tree of the 'supercluster' (COG0219, COG0565, COG0566). Triangles labeled with COG names indicate monophyletic families. All branches are labeled with the support according to the interior branch test.
Figure 12
Figure 12
A speculative scenario of the evolutionary history of the SPOUT superfamily. This scenario is based on the assumption that Bacteria, Archaea, and Eukaryota are all monophyletic, that Archaea and Eukaryota are sister lineages, and that the root (corresponding to the LUCA) is located in the branch between Bacteria and the Last Common Ancestor of Eukaryota and Archaea (LCAEA). Three major branches corresponding to the three Domains of Life. Lines in different colors indicate COGs (blue: 2'-O-ribose methylation, red: m1G methylation, green: m3U methylation, grey – unknown). Crosses indicate extinction. Dotted arrows indicate putative horizontal gene transfers. Dashed ellipses indicate uncertainty in the assignment of genes that underwent duplication to yield a particular COG, e.g. they encompass sets of potential mother lineages.
Figure 13
Figure 13
Possible origins of the knot. A) Contemporary knotted SPOUT fold, exemplified by E. coli YbeA (1ns5). B) Putative ancestral structure, 'unknotted' by deletion of an α/β unit. C) Alternative putative ancestral structure, 'unknotted' by circular permutation, i.e. linking 'old' termini and cutting the knot to create new termini. Protein sequence is colored from blue (N-terminus) to red (C-terminus).

References

    1. Anantharaman V, Koonin EV, Aravind L. SPOUT: a class of methyltransferases that includes spoU and trmD RNA methylase superfamilies, and novel superfamilies of predicted prokaryotic RNA methylases. J Mol Microbiol Biotechnol. 2002;4:71–75. - PubMed
    1. Nureki O, Shirouzu M, Hashimoto K, Ishitani R, Terada T, Tamakoshi M, Oshima T, Chijimatsu M, Takio K, Vassylyev DG, Shibata T, Inoue Y, Kuramitsu S, Yokoyama S. An enzyme with a deep trefoil knot for the active-site architecture. Acta Crystallogr D Biol Crystallogr. 2002;58:1129–1137. doi: 10.1107/S0907444902006601. - DOI - PubMed
    1. Michel G, Sauve V, Larocque R, Li Y, Matte A, Cygler M. The structure of the RlmB 23S rRNA methyltransferase reveals a new methyltransferase fold with a unique knot. Structure (Camb) 2002;10:1303–1315. doi: 10.1016/S0969-2126(02)00852-3. - DOI - PubMed
    1. Schubert HL, Blumenthal RM, Cheng X. Many paths to methyltransfer: a chronicle of convergence. Trends Biochem Sci. 2003;28:329–335. doi: 10.1016/S0968-0004(03)00090-2. - DOI - PMC - PubMed
    1. Kozbial PZ, Mushegian AR. Natural history of S-adenosylmethionine-binding proteins. BMC Struct Biol. 2005;5:19. doi: 10.1186/1472-6807-5-19. - DOI - PMC - PubMed

Publication types

Substances

LinkOut - more resources