Comparative Study
. 2007 May;176(1):351-9.
doi: 10.1534/genetics.106.067355. Epub 2007 Mar 4.

Genetic similarities within and between human populations

Affiliations
Comparative Study

Genetic similarities within and between human populations

D J Witherspoon et al. Genetics. 2007 May.

Abstract

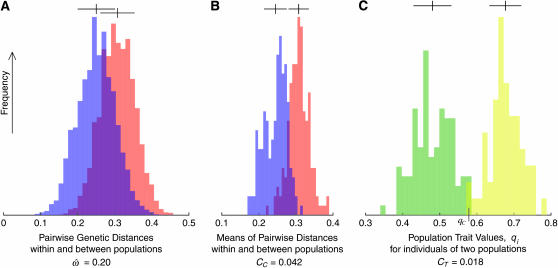
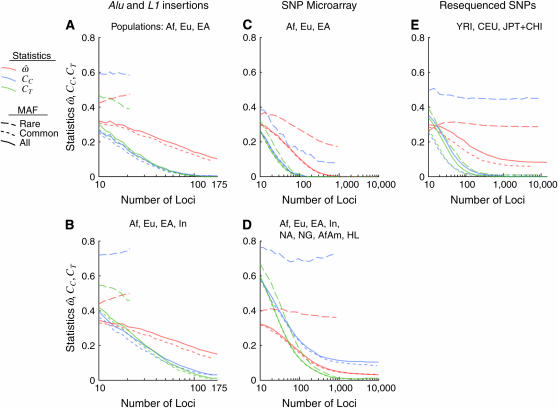
The proportion of human genetic variation due to differences between populations is modest, and individuals from different populations can be genetically more similar than individuals from the same population. Yet sufficient genetic data can permit accurate classification of individuals into populations. Both findings can be obtained from the same data set, using the same number of polymorphic loci. This article explains why. Our analysis focuses on the frequency, omega, with which a pair of random individuals from two different populations is genetically more similar than a pair of individuals randomly selected from any single population. We compare omega to the error rates of several classification methods, using data sets that vary in number of loci, average allele frequency, populations sampled, and polymorphism ascertainment strategy. We demonstrate that classification methods achieve higher discriminatory power than omega because of their use of aggregate properties of populations. The number of loci analyzed is the most critical variable: with 100 polymorphisms, accurate classification is possible, but omega remains sizable, even when using populations as distinct as sub-Saharan Africans and Europeans. Phenotypes controlled by a dozen or fewer loci can therefore be expected to show substantial overlap between human populations. This provides empirical justification for caution when using population labels in biomedical settings, with broad implications for personalized medicine, pharmacogenetics, and the meaning of race.


Figures

F<sc>igure</sc> 1.—
Figure 1.—
Frequency distributions of the underlying genetic measures used to compute formula image CC, and CT, for a subset of 50 loci genotyped in 104 sub-Saharan African and 61 European individuals of the insertions data set. The measures shown are (A) 13,530 pairwise genetic distances for within- and between-population pairs of individuals (in blue and red, respectively); (B) 330 genetic distances between each individual and the centroid of each population, for an individual's known population of origin (blue) or other population (red); and (C) 165 population trait values qi for individuals computed relative to the African vs. European population pair. Alleles more common in Africa than in Europe are assigned a value of 0; those more common in Europe are assigned a value of 1. The classification criterion qC is marked. The qi distributions for Africans and Europeans are green and yellow, respectively. The areas of overlap between the distributions do not correspond directly to the dissimilarity fraction or misclassification rates. Distributions that do not overlap imply that formula image = 0 and all individuals can be correctly classified. In C, only three individuals are misclassified. Means and standard deviations are indicated above each distribution by vertical ticks and horizontal bars. The horizontal axes share the same scale. As the number of polymorphic loci used increases, the variances of these distributions decrease while their means remain roughly constant. As a result, the statistics formula image CC, and CT decrease as more loci are used.
F<sc>igure</sc> 2.—
Figure 2.—
Behavior of the dissimilarity fraction ( formula image) and error rates of the “centroid” (CC) and “population trait” (CT) classification methods (red, blue, and green lines, respectively) for each of 15 data subsets (see Table 1 and materials and methods). The number of loci subsampled varies in 21 logarithmic steps from 10 to the maximum for each data subset. At each step, all three statistics were computed for 200 subsampled data sets. Lines indicate the medians of the resulting distributions. Within each section, separate series represent three polymorphism frequency subsets: rare (MAF < 10%, blue contours), common (MAF > 10%, green), and all (all polymorphisms, black; see key). Results computed from the data subsets derived from the insertion, microarray, and resequenced data sets are shown in A and B, C and D, and E, respectively. A and C show results from analyses that use only the three most distinct population groups (Europeans, East Asians, and sub-Saharan Africans, abbreviated Eu, EA, and Af), while B and D show results based on all populations in the insertion and microarray data sets, respectively (Indian, Native American, New Guinean, African American, and Hispano–Latino, abbreviated In, NA, NG, AfAm, and HL). E uses all three population groups in the resequenced data set.

References

    1. American Anthropological Association, 1997. Response to OMB directive 15: race and ethnic standards for federal statistics and administrative reporting (original statement at http://web.archive.org/web/19990507115624/http://www.ameranthassn.org/ombnews.htm; amended 2000 statement at http://www.aaanet.org/gvt/ombdraft.htm).
    1. Bamshad, M., S. Wooding, B. A. Salisbury and J. C. Stephens, 2004. Deconstructing the relationship between genetics and race. Nat. Rev. Genet. 5: 598–609. - PubMed
    1. Bamshad, M. J., S. Wooding, W. S. Watkins, C. T. Ostler, M. A. Batzer et al., 2003. Human population genetic structure and inference of group membership. Am. J. Hum. Genet. 72: 578–589. - PMC - PubMed
    1. Barbujani, G., A. Magagni, E. Minch and L. L. Cavalli-Sforza, 1997. An apportionment of human DNA diversity. Proc. Natl. Acad. Sci. USA 94: 4516–4519. - PMC - PubMed
    1. Bowcock, A. M., A. Ruiz-Linares, J. Tomfohrde, E. Minch, J. R. Kidd et al., 1994. High resolution of human evolutionary trees with polymorphic microsatellites. Nature 368: 455–457. - PubMed

Publication types