. 2007 May;27(9):3313-26.
doi: 10.1128/MCB.01476-06. Epub 2007 Mar 5.

Integrin alpha1beta1 controls reactive oxygen species synthesis by negatively regulating epidermal growth factor receptor-mediated Rac activation

Affiliations

Integrin alpha1beta1 controls reactive oxygen species synthesis by negatively regulating epidermal growth factor receptor-mediated Rac activation

Xiwu Chen et al. Mol Cell Biol. 2007 May.

Abstract

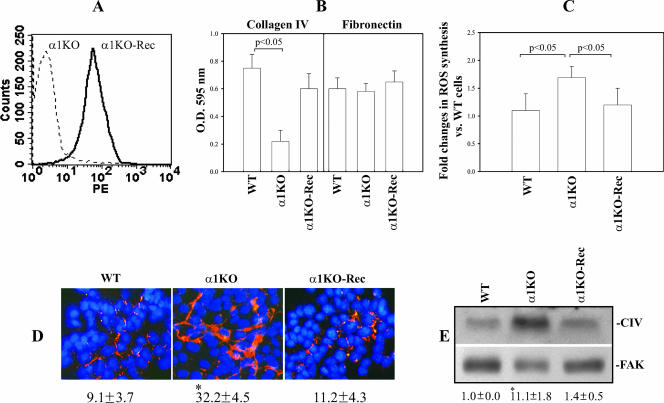
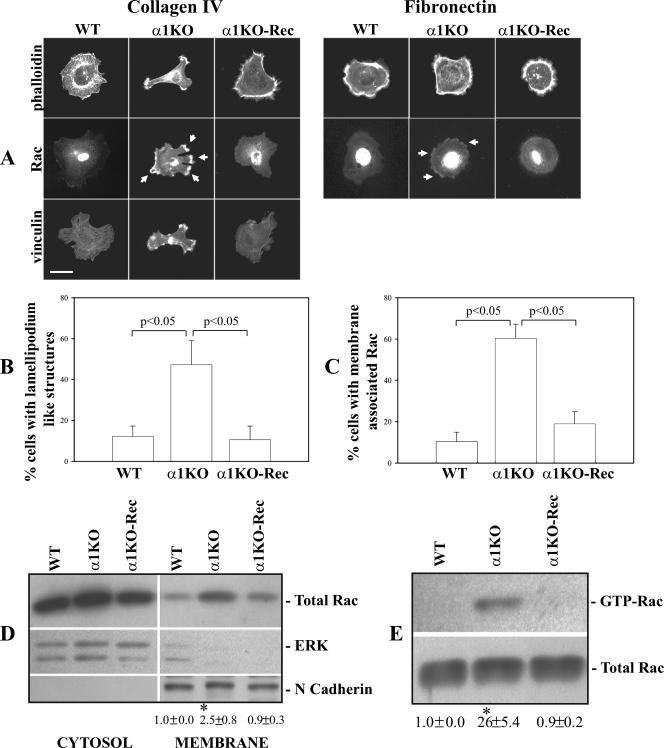
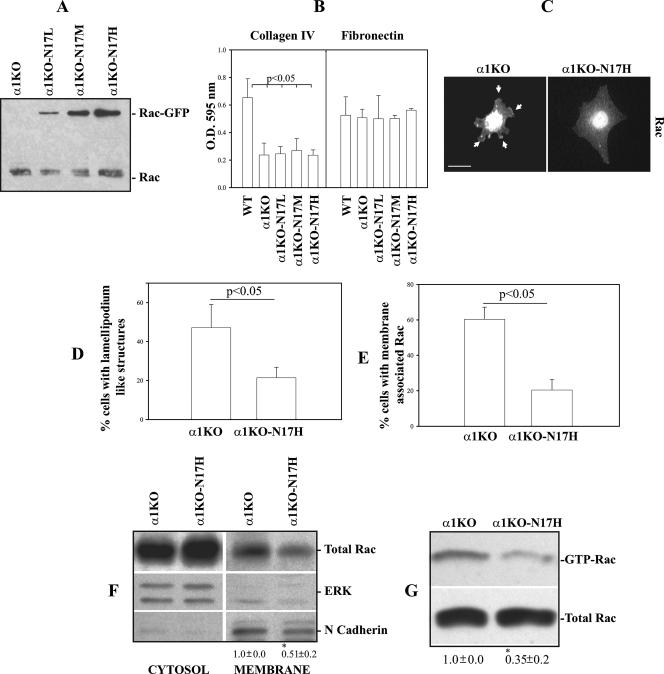
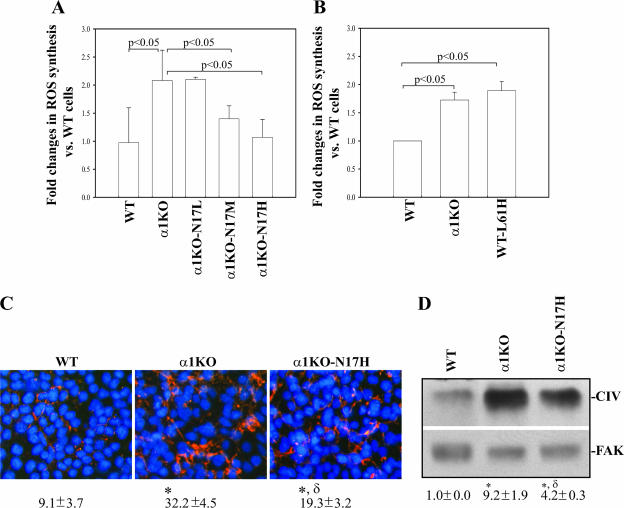
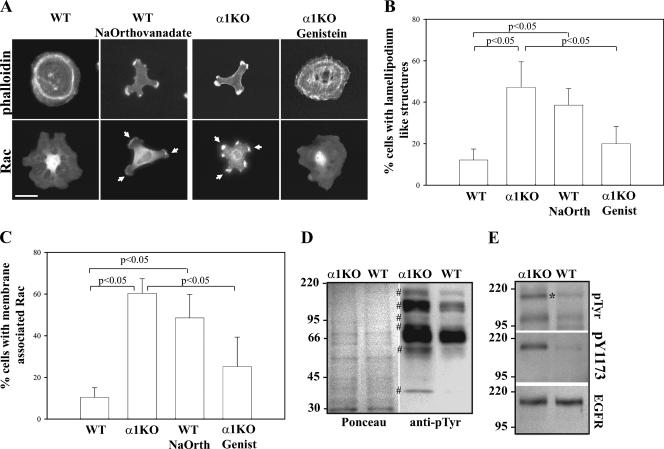
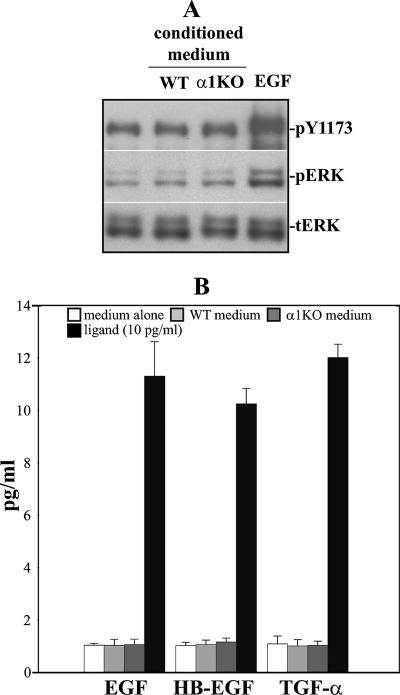
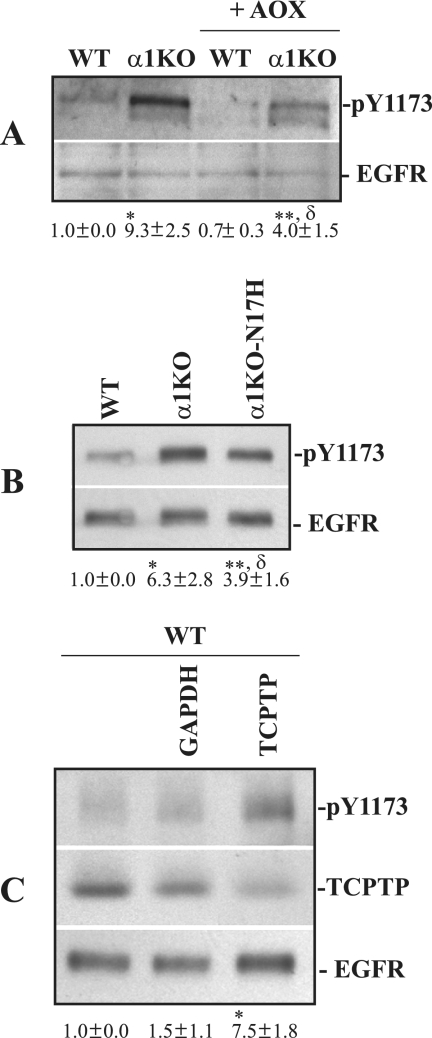
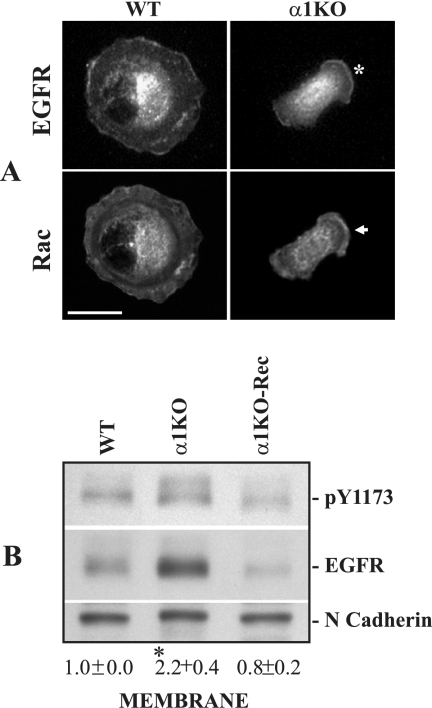
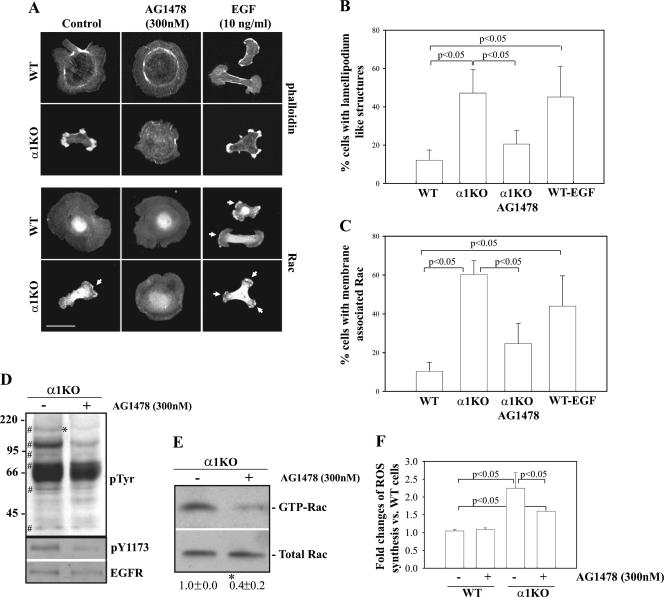
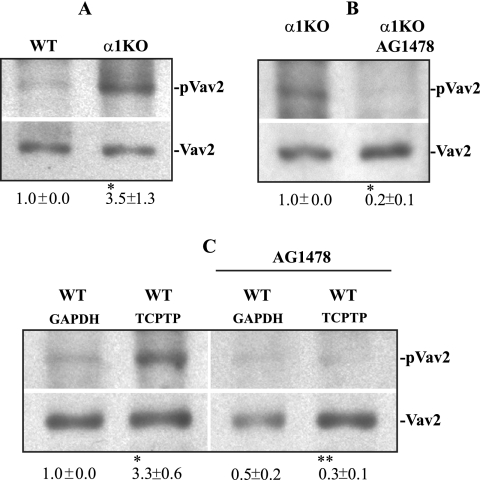
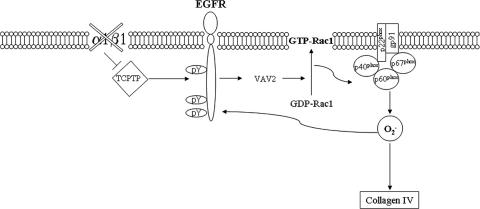
Integrins control many cell functions, including generation of reactive oxygen species (ROS) and regulation of collagen synthesis. Mesangial cells, found in the glomerulus of the kidney, are able to produce large amounts of ROS via the NADPH oxidase. We previously demonstrated that integrin alpha1-null mice develop worse fibrosis than wild-type mice following glomerular injury and this is due, in part, to excessive ROS production by alpha1-null mesangial cells. In the present studies, we describe the mechanism whereby integrin alpha1-null mesangial cells produce excessive ROS. Integrin alpha1-null mesangial cells have constitutively increased basal levels of activated Rac1, which result in its increased translocation to the cell membrane, excessive ROS production, and consequent collagen IV deposition. Basal Rac1 activation is a direct consequence of ligand-independent increased epidermal growth factor receptor (EGFR) phosphorylation in alpha1-null mesangial cells. Thus, our study demonstrates that integrin alpha1beta1-EGFR cross talk is a key step in negatively regulating Rac1 activation, ROS production, and excessive collagen synthesis, which is a hallmark of diseases characterized by irreversible fibrosis.


Figures

FIG. 1.
FIG. 1.
Integrin α1KO mesangial cells transfected with the integrin α1 subunit downregulate ROS and collagen synthesis. (A) Mesangial cells were transfected with either the empty vector (α1KO) or the human integrin α1 subunit cDNA (α1KO-Rec), and cell populations expressing the integrin α1 subunit were sorted by FACS. PE, phycoerythrin. (B) WT, α1KO, and α1KO-Rec mesangial cells were plated in serum-free medium onto collagen IV or fibronectin (10 μg/ml each) and incubated for 1 h, and their adhesion was determined as described in Materials and Methods. Values represent the mean ± standard deviation of three independent experiments performed in quadruplicate. (C) Mesangial cells (15 × 104 cells/well) were plated on uncoated six-well plates in DMEM containing1% FCS. After 2 days, 2 μM dihydrorhodamine was added and ROS generation was evaluated as described in Materials and Methods. Values are as in panel B. (D) Mesangial cells were cultured on uncoated dishes for 72 h in complete medium, and an indirect immunofluorescence assay was performed to evaluate collagen IV deposition. The percentage of the area occupied by collagen IV-positive structures per microscopic field was quantified with the Scion Image program as described in Materials and Methods. Values are the mean ± standard deviation of four independent experiments. An asterisk indicates a significant difference (P < 0.05) between WT and α1KO cells. (E) Lysates (40 μg/lane) from mesangial cells cultured as described for panel D were analyzed by Western blotting for levels of collagen IV (CIV). Membranes were reincubated with anti-FAK antibody to verify equal loading. Collagen IV and FAK bands were quantified by densitometry analysis, and the collagen IV signal is expressed as the collagen IV/FAK ratio. Values are the mean ± standard deviation of three experiments and represent changes (n-fold) relative to WT cells. An asterisk indicates a significant difference (P < 0.05) between WT and α1KO cells.
FIG. 2.
FIG. 2.
Increased membrane-bound and activated Rac1 in integrin α1KO mesangial cells. (A) Mesangial cells were serum starved for 24 h and plated for 3 h on collagen IV or fibronectin (10 μg/ml each), after which they were stained with rhodamine-phalloidin, anti-Rac1, or anti-vinculin antibodies. The arrows indicate membrane-bound Rac1. Scale bar, 10 μm. (B, C) The percentage of cells plated on collagen IV that exhibited lamellipodium-like structures (B), as well as membrane-associated Rac (C), was quantified. Values are the mean ± standard deviation of three experiments (n = 200 cells). (D) Mesangial cells were plated on uncoated dishes, incubated for 48 h, and subsequently serum starved for 24 h. Equal amounts of cytosol and membrane fractions (40 μg/lane) were then analyzed by Western blotting with anti-Rac antibodies. Membranes were then incubated with anti-ERK or anti-N-cadherin antibodies to verify equal loading and purity of the preparation. Rac and N-cadherin bands in membrane fractions were quantified by densitometry analysis, and the Rac signal is expressed as the Rac/N-cadherin ratio. Values are the mean ± standard deviation of three experiments and represent changes (n-fold) relative to WT cells. The asterisk is as in Fig. 1D. (E) Eight hundred micrograms of total cell lysate of mesangial cells incubated as described for panel D was incubated with glutathione S-transferase-PBD beads. Bound GTP-Rac was detected by Western blotting with anti-Rac1 antibody (top). Forty micrograms of total cell lysate was used to detect the levels of total Rac1 (bottom). GTP-Rac and Rac bands were quantified by densitometry analysis, and the activated Rac signal is expressed as the GTP-Rac/N-cadherin ratio. Values and asterisks are as described for panel D.
FIG. 3.
FIG. 3.
Dominant negative Rac1 decreases membrane-bound and activated Rac1 in integrin α1KO mesangial cells. (A) α1KO mesangial cells were transfected with either GFP vector (α1KO) or dominant negative GFP-N17Rac (α1KO-N17) and sorted by FACS into three different cell populations on the basis of levels of GFP (low, medium, high). Endogenous Rac1 and GFP-N17Rac were detected by Western blotting with anti-Rac1 antibody (40 μg cell lysate/lane). (B) Mesangial-cell adhesion on collagen IV or fibronectin (10 μg/ml each) was determined as described in Materials and Methods. Values represent the mean ± standard deviation of three experiments performed in quadruplicate. (C) Serum-starved mesangial cells were plated on collagen IV (10 μg/ml) and incubated for 3 h, and Rac localization was analyzed with anti-Rac antibodies. Arrows represent membrane-associated Rac. Scale bar, 10 μm. (D, E) The percentages of cells plated on collagen IV that exhibited lamellipodium-like structures (D) and membrane-associated Rac (E) were quantified. Values are the mean ± standard deviation of three experiments (n = 150 cells). (F) Cytosol and membrane fractions (40 μg/lane) of mesangial cells were analyzed by Western blotting with anti-Rac antibodies. Membranes were subsequently incubated with anti-ERK or anti-N-cadherin antibodies to verify equal loading and the purity of the preparation. Rac and N-cadherin bands in membrane fractions were quantified and expressed as described in the legend to Fig. 2D. Values are the mean ± standard deviation of three experiments and represent changes (n-fold) relative to α1KO cells. An asterisk indicates a significant difference (P < 0.05) between α1KO and α1KO-N17H cells. (G) Eight hundred micrograms of total mesangial-cell lysate was incubated with glutathione S-transferase-PBD beads, and bound GTP-Rac or total Rac was detected by Western blotting. GTP-Rac and Rac bands were quantified and expressed as described in the legend to Fig. 2E. Values and asterisks are as already described.
FIG. 4.
FIG. 4.
Dominant negative Rac1 partially decreases ROS generation and collagen deposition in integrin α1KO mesangial cells. (A, B) Mesangial cells (15 × 104/well) were plated on uncoated six-well plates in DMEM containing 1% FCS. After 2 days, 2 μM dihydrorhodamine was added and ROS generation was evaluated as described in Materials and Methods. Values represent the mean ± standard deviation of three experiments performed in triplicate. (C) Mesangial cells were cultured as described in the legend to Fig. 1D, and collagen IV deposition was evaluated by indirect immunofluorescence assay. The percentage of the area occupied by collagen IV-positive structures per microscopic field was quantified with the Scion Image program as described in Materials and Methods. Values are the mean ± standard deviation of four experiments. Differences between WT and α1KO cells (*) or α1WT and α1KO-N17H cells (δ) were significant at P < 0.05. (D) Collagen IV (CIV) levels in cell lysates (40 μg/lane) were detected by Western blot analysis and are expressed as described in the legend to Fig. 1E. Symbols (* and δ) are as already described.
FIG. 5.
FIG. 5.
Increased tyrosine phosphorylation in integrin α1KO mesangial cells leads to increased membrane-bound Rac1. (A) Mesangial cells were serum starved for 24 h with or without Na orthovanadate (25 μM) or genistein (20 μM). Cells were subsequently plated for 3 h on collagen IV (10 μg/ml) with or without Na orthovanadate (5 μM) or genistein (5 μM) and stained with rhodamine-phalloidin or anti-Rac1 antibodies. The arrowheads indicate membrane-bound Rac1. Scale bar, 10 μm. (B, C) The percentages of cells plated on collagen IV that exhibited lamellipodium-like structures (B) and membrane-associated Rac (C) were quantified. Values are the mean ± standard deviation of three experiments (n = 150 cells). (D) Total tyrosine phosphorylation in serum-starved cells was determined with an anti-phosphotyrosine antibody (40 μg total cell lysate/lane). The symbol # indicates tyrosine-phosphorylated proteins highly increased in α1KO cells. (E) Mesangial-cell lysates (40 μg/lane) prepared as described for panel D were analyzed by Western blotting with antiphosphotyrosine, anti-pY1173, and anti-EGFR antibodies. The asterisk indicates the position of the EGFR. The values on the left are molecular sizes in kilodaltons.
FIG. 6.
FIG. 6.
WT and α1KO mesangial cells do not secrete detectable levels of EGFR ligands. (A) Serum-starved A431 cells were kept untreated, treated with medium conditioned for 72 h with WT and α1KO mesangial cells, or treated with 10 ng/ml EGF. After 10 min, total cell lysates (5 μg/lane) were analyzed by Western blotting for phosphorylated EGFR, as well as phosphorylated and total ERK. (B) One hundred microliters of medium conditioned for 72 h with WT and α1KO mesangial cells was used to analyze the levels of secreted EGF, HB-EGF, and TGF-α by ELISA (see Materials and Methods for details). Concentrated medium alone or 10 pg/ml purified mouse EGF, HB-EGF, or TGF-α was used as a negative or positive control, respectively.
FIG. 7.
FIG. 7.
ROS partially contribute to increased EGFR phosphorylation in integrin α1KO mesangial cells. (A) Mesangial cells were serum starved for 24 h with or without antioxidants (AOX) (see Materials and Methods for details), and total cell lysates (40 μg/lane) were analyzed by Western blotting with anti-pY1173 or anti-EGFR antibodies. Phosphorylated and total EGFR bands were quantified by densitometry analysis, and phosphorylated EGFR is expressed as the pY1173/EGFR ratio. Values are the mean ± standard deviation of three experiments and are expressed as changes (n-fold) relative to WT cells. Differences between WT and α1KO (*), WT and α1KO+AOXs (**), or α1KO and α1KO+AOXs (δ) cells were significant at P < 0.05. (B) The mesangial cells indicated were serum starved for 24 h, and the levels of phosphorylated and total EGFR were analyzed by Western blotting. Phosphorylated EGFR bands were quantified and expressed as indicated above. Differences between WT and α1KO (*), WT and α1KO-N17H (**), or α1KO and α1KO-N17H (δ) cells were significant at P < 0.05. (C) Cell lysates (40 μg/lane) of serum-starved WT mesangial cells either left untransfected or transfected with the siRNAs indicated were analyzed by Western blotting with anti-pY1173, anti-TCPTP, and anti-EGFR antibodies. Phosphorylated EGFR and TCPTP bands were quantified by densitometric analysis and normalized to total EGFR bands. Values are the mean ± standard deviation of three experiments and are expressed as changes (n-fold) in pY1173/TCPTP relative to WT cells. Differences between untransfected and TCPTP siRNA-transfected cells (*) were significant at P < 0.05. GAPDH, glyceraldehyde-3-phosphate dehydrogenase.
FIG. 8.
FIG. 8.
Increased membrane-associated EGFR in integrin α1KO mesangial cells. (A) Mesangial cells were serum starved for 24 h, subsequently plated for 3 h on collagen IV (10 μg/ml), and double stained with anti-EGFR and anti-Rac1 antibodies. The asterisk and arrow indicate localization of membrane-associated EGFR and Rac, respectively. Scale bar, 10 μm. (B) Membrane fractions (40 μg/lane) from mesangial cells were analyzed by Western blotting with anti-pY1173 and anti-EGFR antibodies. Membranes were subsequently incubated with anti-N-cadherin antibodies to verify equal loading. pY1173 and N-cadherin bands were quantified by densitometric analysis, and the results are expressed as the pY1173/N-cadherin ratio. Values are the mean ± standard deviation of three experiments and represent changes (n-fold) relative to WT cells. Differences between WT and α1KO cells (*) were significant at P < 0.05.
FIG. 9.
FIG. 9.
Increased EGFR phosphorylation in integrin α1KO mesangial cells upregulates Rac1 activation and ROS generation. (A) Mesangial cells serum starved for 24 h with or without AG1478 (300 nM) were plated onto collagen IV (10 μg/ml), incubated for 3 h with or without AG1478 (300 nM) or EGF (100 ng/ml), and stained with rhodamine-phalloidin or anti-Rac1 antibody. The arrows indicate membrane-bound Rac1. Scale bar, 10 μm. (B, C) The percentages of cells plated on collagen IV that exhibited lamellipodium-like structures (B) and membrane-associated Rac (C) were quantified. Values are the mean ± standard deviation of three experiments (n = 150 cells). (D) α1KO cells were serum starved for 24 h as indicated for panel A, and cell lysates (40 μg/lane) were analyzed by Western blotting with anti-phosphotyrosine, anti-pY1173, and anti-EGFR antibodies. The symbol # indicates tyrosine-phosphorylated proteins highly increased in α1KO cells, while the asterisk indicates the position of the EGFR. The values on the left are molecular sizes in kilodaltons. (E) α1KO cells were serum starved for 24 h as indicated for panel A, and GTP-Rac or total Rac1 levels were detected as described in the legend to Fig. 2C. GTP-Rac and Rac bands were quantified and expressed as described in the legend to Fig. 2E. Values are the mean ± standard deviation of three experiments and represent changes (n-fold) relative to untreated α1KO cells. The asterisk indicates a significant difference (P < 0.05) between untreated and AG1478-treated cells. (F) Mesangial cells were plated in six-well plates at a density of 15 × 104/well in DMEM containing 1% FCS with or without AG1478 (300 nM). After 2 days, 2 μM dihydrorhodamine was added to the wells and ROS generation was evaluated. Values represent the mean ± standard deviation of three independent experiments performed in triplicate.
FIG. 10.
FIG. 10.
Increased basal levels of phosphorylated Vav2 in α1KO mesangial cells. (A) Mesangial cells were plated on uncoated dishes, incubated for 48 h, and subsequently serum starved for 24 h. Forty micrograms of cell lysate was then analyzed by Western blotting with anti-pVav2 (Tyr-172) or anti-Vav2 antibodies. pVav2 and Vav2 bands were quantified by densitometry analysis, and the pVav2 signal is expressed as the pVav2/Vav2 ratio. Values are the mean ± standard deviation of three experiments and represent changes (n-fold) relative to WT cells. Differences between WT and α1KO cells (*) were significant at P < 0.05. (B) α1KO mesangial cells incubated as described above were serum starved for 24 h with or without AG1478 (300 nM). Forty micrograms of cell lysate was analyzed by Western blotting with the antibodies indicated above. pVav2 and Vav2 bands were quantified, and the results are expressed as indicated above. Values are the mean ± standard deviation of three experiments and represent changes (n-fold) relative to untreated α1KO cells. Differences between untreated and AG1478-treated cells (*) were significant at P < 0.05. (C) WT mesangial cells transfected with the siRNAs indicated were serum starved for 24 h with or without AG1478 (300 nM). Forty micrograms of cell lysate was analyzed by Western blotting with the antibodies indicated above. pVav2 and Vav2 bands were quantified and expressed as indicated above. Values are the mean ± standard deviation of three experiments and are expressed as changes (n-fold) relative to untreated WT cells transfected with GAPDH (glyceraldehyde-3-phosphate dehydrogenase) siRNA. Differences between GAPDH siRNA versus TCPTP siRNA-transfected cells (*) and TCPTP siRNA versus TCPTP siRNA-plus-antioxidant cells (**) were significant at P < 0.05.
FIG. 11.
FIG. 11.
Regulation of ROS and collagen synthesis in α1KO mesangial cells. Schematic model of how ROS (O2) and collagen might be regulated in α1KO mesangial cells. Lack of integrin α1β1 results in increased EGFR phosphorylation, Vav2 recruitment, Rac1 activation, and NAPDH-mediated O2 production. Increased O2 can subsequently lead to both enhanced collagen IV synthesis and EGFR phosphorylation.

References

    1. Block, K., J. M. Ricono, D. Y. Lee, B. Bhandari, G. G. Choudhury, H. E. Abboud, and Y. Gorin. 2006. Arachidonic acid-dependent activation of a p22phox-based NAD(P)H oxidase mediates angiotensin II-induced mesangial cell protein synthesis and fibronectin expression via Akt/PKB. Antioxid. Redox Signal. 8:1497-1508. - PubMed
    1. Bokoch, G. M., and B. A. Diebold. 2002. Current molecular models for NADPH oxidase regulation by Rac GTPase. Blood 100:2692-2696. - PubMed
    1. Bokoch, G. M., and T. Zhao. 2006. Regulation of the phagocyte NADPH oxidase by Rac GTPase. Antioxid. Redox Signal. 8:1533-1548. - PubMed
    1. Chen, X., G. Moeckel, J. D. Morrow, D. Cosgrove, R. C. Harris, A. B. Fogo, R. Zent, and A. Pozzi. 2004. Lack of integrin α1β1 leads to severe glomerulosclerosis after glomerular injury. Am. J. Pathol. 165:617-630. - PMC - PubMed
    1. Chiarugi, P. 2005. PTPs versus PTKs: the redox side of the coin. Free Radic. Res. 39:353-364. - PubMed

Publication types

MeSH terms