. 2007 May;27(9):3456-69.
doi: 10.1128/MCB.01719-06. Epub 2007 Mar 5.

Insulin stimulates membrane fusion and GLUT4 accumulation in clathrin coats on adipocyte plasma membranes

Affiliations

Insulin stimulates membrane fusion and GLUT4 accumulation in clathrin coats on adipocyte plasma membranes

Shaohui Huang et al. Mol Cell Biol. 2007 May.

Abstract

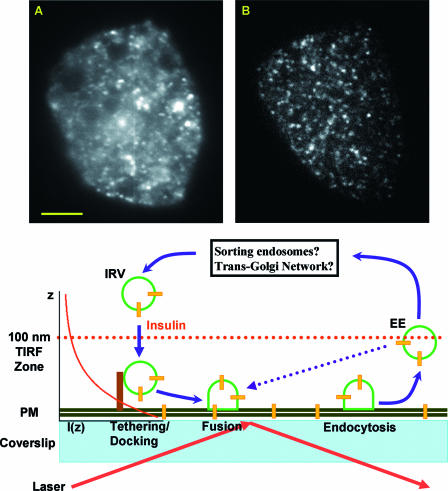
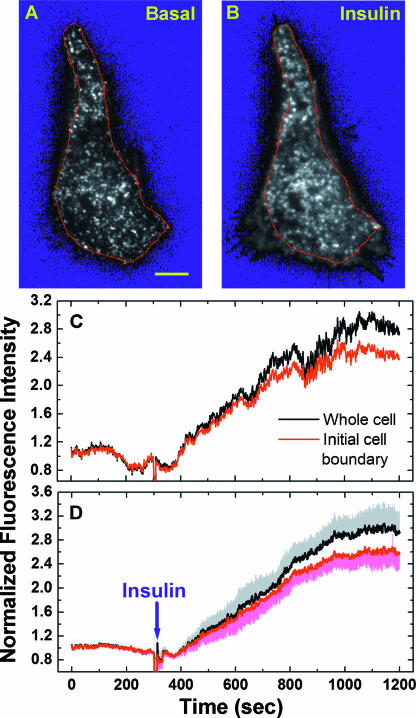
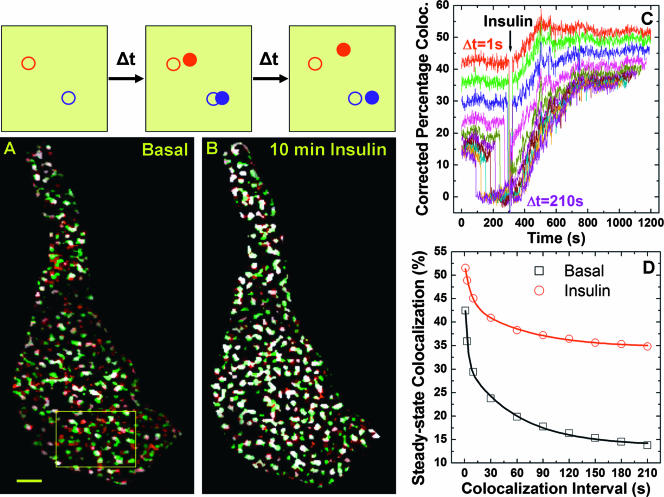
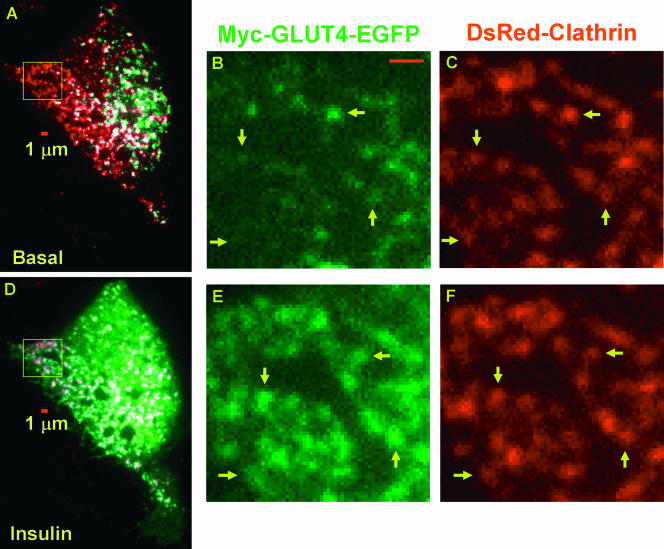
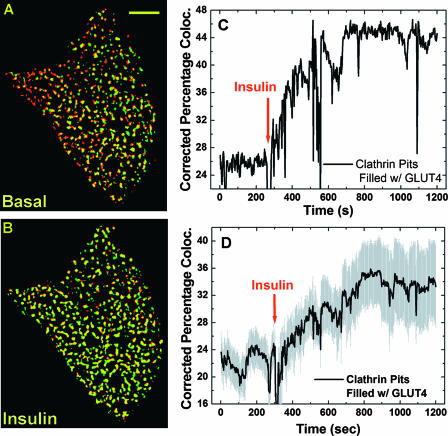
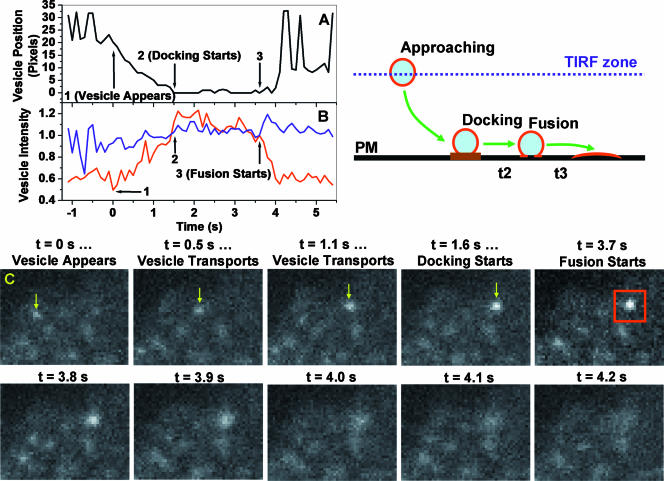
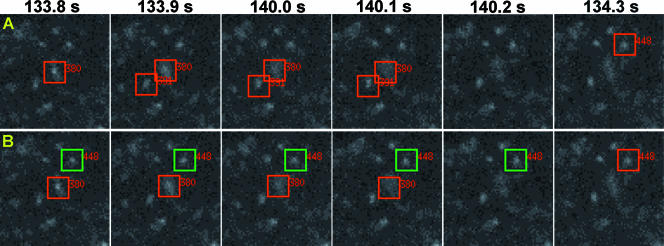
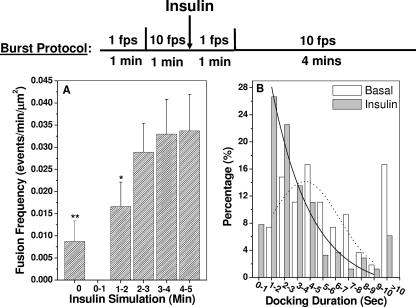
Total internal reflection fluorescence (TIRF) microscopy reveals highly mobile structures containing enhanced green fluorescent protein-tagged glucose transporter 4 (GLUT4) within a zone about 100 nm beneath the plasma membrane of 3T3-L1 adipocytes. We developed a computer program (Fusion Assistant) that enables direct analysis of the docking/fusion kinetics of hundreds of exocytic fusion events. Insulin stimulation increases the fusion frequency of exocytic GLUT4 vesicles by approximately 4-fold, increasing GLUT4 content in the plasma membrane. Remarkably, insulin signaling modulates the kinetics of the fusion process, decreasing the vesicle tethering/docking duration prior to membrane fusion. In contrast, the kinetics of GLUT4 molecules spreading out in the plasma membrane from exocytic fusion sites is unchanged by insulin. As GLUT4 accumulates in the plasma membrane, it is also immobilized in punctate structures on the cell surface. A previous report suggested these structures are exocytic fusion sites (Lizunov et al., J. Cell Biol. 169:481-489, 2005). However, two-color TIRF microscopy using fluorescent proteins fused to clathrin light chain or GLUT4 reveals these structures are clathrin-coated patches. Taken together, these data show that insulin signaling accelerates the transition from docking of GLUT4-containing vesicles to their fusion with the plasma membrane and promotes GLUT4 accumulation in clathrin-based endocytic structures on the plasma membrane.


Figures

FIG. 1.
FIG. 1.
TIRF microscopy reveals abundant GLUT4 vesicles underneath the PM of 3T3-L1 adipocytes. Both the wide-field (A) and TIRF (B) images are taken from the same adipocyte while focusing on the coverslip-attached PM. Scale bar in panel A, 5 μm. The TIRF evanescence field decays exponentially according to the equation I(z) = I(0) × exp(−z/D), where I(0) and I(z) are excitation intensities at the coverslip-water interface and at z distance away from that interface, respectively (see diagram at right side of the cartoon illustration). The characteristic penetration depth (D) of the TIRF evanescence field is typically measured to be ∼100 nm (see Materials and Methods). Thus, within this field, exocytic vesicle docking and fusion, as well as GLUT4 endocytosis, can be observed (see illustration). Insulin mobilizes intracellular insulin-responsive, GLUT4-containing vesicles (IRVs) towards the PM. The dotted blue line suggests a potential “short-circuit” pathway through which GLUT4-containing early endosomes (EEs) recycle back to the PM without going through intracellular sorting compartments (see black box).
FIG. 2.
FIG. 2.
Insulin stimulates GLUT4 exocytosis to the PM. Adipocytes transiently expressing GLUT4-EGFP were serum starved >2 h (i.e., basal conditions) before TIRF microscopy. Single-cell imaging was carried out at 1 fps for 5 min under the basal conditions, followed by 15 min of stimulation with 100 nM insulin (see Movie S1 in the supplemental material). Thus, a total of 1,200 images (i.e., img1 to img1200) were acquired, and img3 (A) and img902 (B) are representative cell conditions before and after insulin stimulation, respectively. Scale bar in panel A, 5 μm. After subtracting background signals (see the resulting blue background in panels A and B), remaining fluorescence intensities of the whole cell or within the initial cell boundary (i.e., red lines in A and B) were normalized to their respective average intensities before insulin addition and were plotted in panel C. The average insulin-induced fluorescence intensity changes for eight adipocytes are plotted in panel D, together with the standard errors of the mean.
FIG. 3.
FIG. 3.
Insulin promotes apparent immobilization of punctate GLUT4 structures. The principle of estimating vesicle mobility based on temporal colocalization (coloc.) between pairs of images separated by Δt is illustrated. For example, a fast-moving vesicle (red circles) has already moved away from its original position (open red circle) over Δt, while a slow-moving vesicle (blue circles) still partially overlaps with its original position (open blue circle). Over 2× Δt, both vesicles have no colocalization with their original positions. Thus, the degree of temporal colocalization is inversely related to vesicle mobility. To eliminate colocalization of background signals, GLUT4-containing structures were first isolated from each TIRF image using algorithms demonstrated in Fig. S1 in the supplemental material. The initial cell boundary outlined in Fig. 2 is used to retain the same area for colocalization analysis. Image A shows colocalized regions (white) between two images acquired under basal conditions and separated by 1 s (Δt = 1 s; green, early image [EI]; red, later image [LI]). Ten minutes after insulin addition, such colocalized regions (white) increase dramatically (B). Scale bar in panel A, 2 μm. Colocalization details within a magnified segment of the cell (box in A) for the entire image sequence (i.e., img1 versus img2, img2 versus img3 … img1199 versus img1200) are included in Movie S2 in the supplemental material. PC is defined as the percentage of pixels in EI colocalizing with pixels in LI. The corrected PC values (corrected for random colocalization; see Materials and Methods) for Δt values of 1 s, 3 s, 10 s, 30 s, 60 s, 90 s, 120 s, 150 s, 180 s, and 210 s are computed for the whole image sequence and are plotted in panel C. Increasing Δt values result in decreasing PC values (C). Thus, the average PC values before (averaged between 0 and 30 s in panel C) and after (averaged between 900 and 930 s in panel C) insulin addition are plotted against their respective Δt intervals in panel D. Lines in panel D represent nonlinear least-square fits of the data using a two-exponential decay model (see Fig. S2 in the supplemental material for detail).
FIG. 4.
FIG. 4.
Insulin promotes GLUT4 accumulation in clathrin-coated membranes. Two-color TIRF microscopy of adipocytes coexpressing GLUT4-EGFP and clathrin-dsRed was carried out under the basal conditions for 5 min, followed by 100 nM insulin stimulation for 15 min. One GLUT4-EGFP image and one clathrin-dsRed image were acquired every 2 s with a 200-ms interval between the green and red images. Thus, a total of 1,200 TIRF images can be split into individual GLUT4 (see Movie S3 in the supplemental material) and clathrin (see Movie S4 in the supplemental material) movies, each containing 600 images acquired at one frame per 2 s. Representative colocalization (white) between GLUT4 (green) and clathrin (red) compartments acquired before or 10 min after insulin stimulation are shown in images A and D, respectively. Magnified views of the boxed regions (64 by 64 pixels) in images A and D are shown in images B and C and images E and F, respectively. Although images C and F were taken 15 min apart, the same pattern of clathrin distribution, although laterally shifted, is still distinguishable (e.g., arrows in C and F). In contrast, GLUT4 occupancy of these clathrin-coated membranes increases dramatically after insulin stimulation (compare B and E). Scale bars in images A, B, and D are 1 μm.
FIG. 5.
FIG. 5.
Quantification of insulin-stimulated GLUT4 accumulation in clathrin-coated membranes. Binary images containing the punctate GLUT4 or clathrin structures (see Fig. S3 in the supplemental material) were prepared using algorithms demonstrated in Fig. S1 in the supplemental material. Representative colocalization (yellow) images between pairs of binary GLUT4 (green) and clathrin (red) images are shown in A and B for the basal and 10-min insulin stimulation conditions, respectively. Scale bar in A is 5 μm. For the entire image sequence (i.e., 600 pairs of GLUT4 and clathrin images; see Movies S3 and S4 in the supplemental material), the percentages of clathrin pixels colocalizing with corresponding GLUT4 pixels, corrected for random colocalization (see Materials and Methods), are shown in panel C (i.e., spatial clathrin-GLUT4 colocalization). Fluctuations in the colocalization curve (e.g., between ∼500 s and ∼550 s) are due to focus drifts in the TIRF images (see corresponding time windows in Movies S3 and S4 in the supplemental material) but not due to dramatic changes in clathrin-GLUT4 colocalization. The average values of the clathrin-GLUT4 colocalization kinetics are shown in panel D with associated standard errors of the mean (gray shading).
FIG. 6.
FIG. 6.
Kinetics of single GLUT4 vesicle docking and fusion with the PM. TIRF imaging at 10 fps of 3T3-L1 adipocytes transiently expressing GLUT4-EGFP was carried out using a burst protocol, illustrated in Fig. 8. For each fusion event, three parameters are obtained: peak vesicle intensity (IP; see the text), total vesicle intensity (IV), and vesicle position (PV). The IP (red line) and IV intensities (blue line) are normalized to their respective values obtained at the fusion time (i.e., arrow 3 in panels A and B; red box in panel C) and are plotted in panel B. Assigning vesicle position 0 at the fusion site (i.e., arrow 3 in panel A), vesicle distances to the fusion site are computed and plotted in panel A. Critical stages of the docking/fusion process (i.e., vesicle appears, docking starts, and fusion starts) are indicated by arrows in panels A and B, and representative images are shown in panel C. The cartoon illustrates distinct stages of single-vesicle transport, docking, and fusion.
FIG. 7.
FIG. 7.
Fusion Assistant. We have developed a computer program (i.e., Fusion Assistant) that assists the identification and characterization of single-vesicle docking/fusion kinetics. For example, Fusion Assistant identifies three candidate fusion events starting at 133.8 s, 133.9 s, or 134.3 s after insulin addition (A). These potential fusion events are numbered (380, 391, and 448) and are continuously highlighted with red boxes (1.3 by 1.3 μm) for visual confirmation. For fusion event 448, only the start of the fusion at 134.3 s is shown. Two fusion events (380 and 448) are confirmed and highlighted with red boxes (B). Docked vesicle positions are highlighted with green boxes (examples shown for fusion 448 in B only). All candidate fusion events identified by Fusion Assistant in the last minutes of insulin stimulation (see burst protocol in Fig. 8) are shown in Movie S9 in the supplemental material, and those visually confirmed and their associated docked vesicle positions are shown in Movie S10 in the supplemental material.
FIG. 8.
FIG. 8.
Insulin increases the fusion frequency of exocytic GLUT4 vesicles and decreases docking duration prior to vesicle fusion. Burst protocol: periods of 1 min of imaging at 1 fps are used to establish imaging focus for subsequent burst imaging at 10 fps (see illustration). Fusion Assistant combined with visual confirmation (Fig. 7) identified 54 fusion events in 6 quiescent adipocytes and 244 fusion events in 3 insulin-stimulated cells. Fusion frequencies (fusion events per min per μm2 of coverslip-attached PM) for each minute of the burst imaging are plotted in panel A, together with associated standard errors of the mean. The fusion frequencies obtained before insulin addition and during the 1- to 2-min period of insulin stimulation are different from that obtained at the 4- to 5-min period of insulin stimulation at confidence levels of 99% (**) and 90% (*), respectively. Distributions of vesicle docking durations for fusion events before (white bars) and after (gray bars) insulin addition are plotted in panel B. Solid and dotted lines are nonlinear least-square fits of the data (between 1 and 10 s) using Poisson and Gaussian distribution models, respectively.

References

    1. Bai, L., Y. Wang, J. Fan, Y. Chen, W. Ji, A. Qu, P. Xu, D. E. James, and T. Xu. 2007. Dissecting multiple steps of GLUT4 trafficking and identifying the sites of insulin action. Cell Metab. 5:47-57. - PubMed
    1. Bellve, K. D., D. Leonard, C. Standley, L. M. Lifshitz, R. A. Tuft, A. Hayakawa, S. Corvera, and K. E. Fogarty. 2006. Plasma membrane domains specialized for clathrin-mediated endocytosis in primary cells. J. Biol. Chem. 281:16139-16146. - PubMed
    1. Blot, V., and T. E. McGraw. 2006. GLUT4 is internalized by a cholesterol-dependent nystatin-sensitive mechanism inhibited by insulin. EMBO J. 25:5648-5658. - PMC - PubMed
    1. Bogan, J. S., A. E. McKee, and H. F. Lodish. 2001. Insulin-responsive compartments containing GLUT4 in 3T3-L1 and CHO cells: regulation by amino acid concentrations. Mol. Cell. Biol. 21:4785-4806. - PMC - PubMed
    1. Bose, A., A. Guilherme, S. I. Robida, S. M. Nicoloro, Q. L. Zhou, Z. Y. Jiang, D. P. Pomerleau, and M. P. Czech. 2002. Glucose transporter recycling in response to insulin is facilitated by myosin Myo1c. Nature 420:821-824. - PubMed

Publication types