. 2007 Mar 12;176(6):795-805.
doi: 10.1083/jcb.200701066. Epub 2007 Mar 5.

Propagation of centromeric chromatin requires exit from mitosis

Affiliations

Propagation of centromeric chromatin requires exit from mitosis

Lars E T Jansen et al. J Cell Biol. .

Abstract

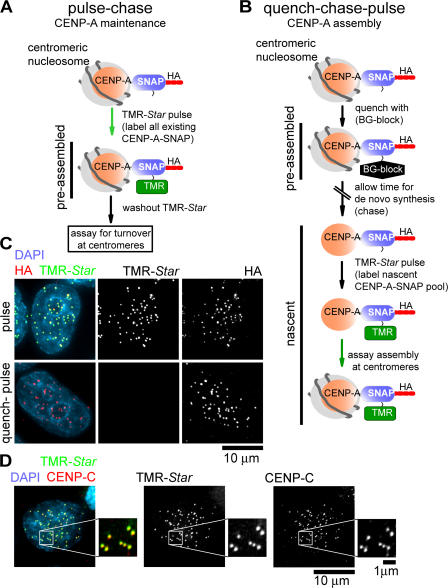
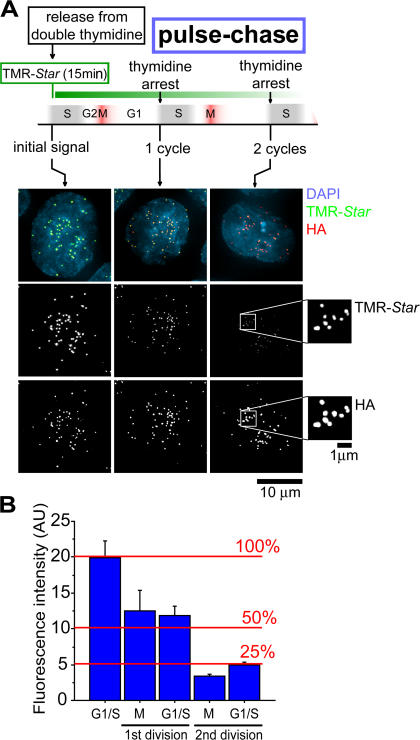
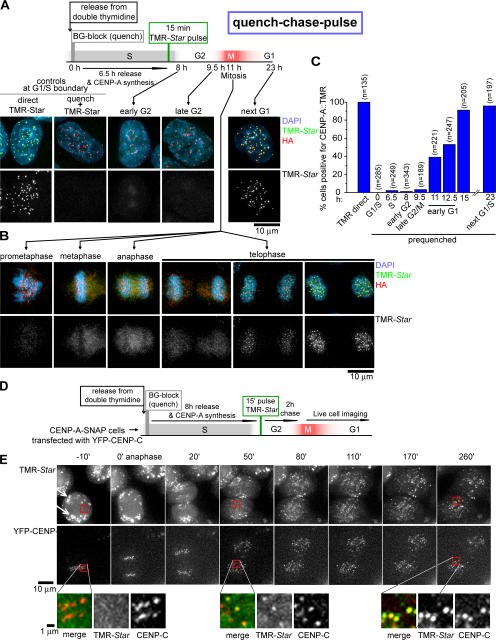
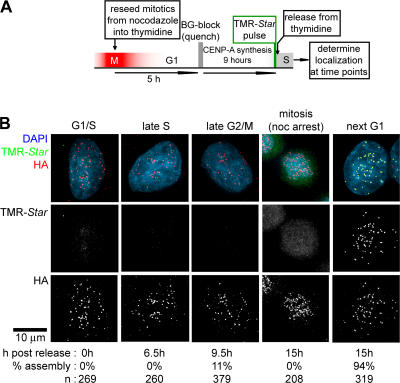
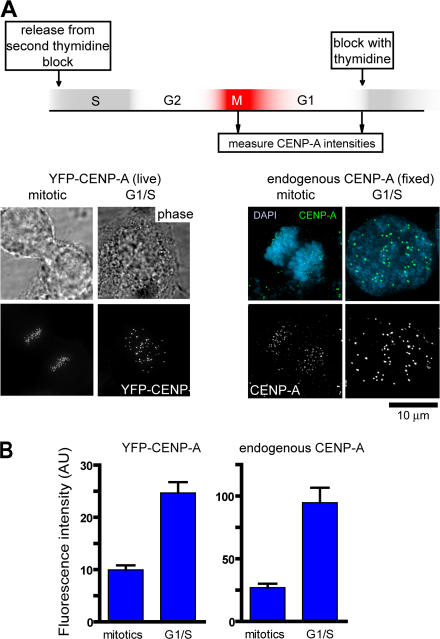
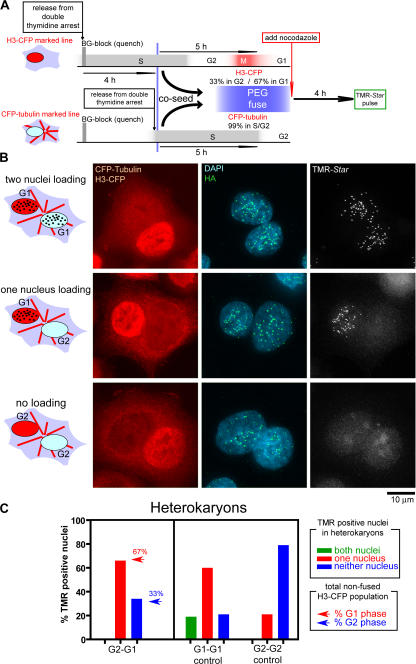
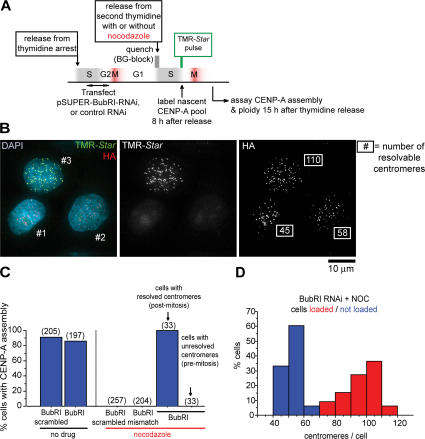
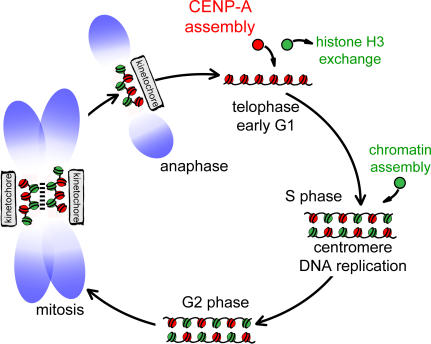
Centromeres direct chromosomal inheritance by nucleating assembly of the kinetochore, a large multiprotein complex required for microtubule attachment during mitosis. Centromere identity in humans is epigenetically determined, with no DNA sequence either necessary or sufficient. A prime candidate for the epigenetic mark is assembly into centromeric chromatin of centromere protein A (CENP-A), a histone H3 variant found only at functional centromeres. A new covalent fluorescent pulse-chase labeling approach using SNAP tagging has now been developed and is used to demonstrate that CENP-A bound to a mature centromere is quantitatively and equally partitioned to sister centromeres generated during S phase, thereby remaining stably associated through multiple cell divisions. Loading of nascent CENP-A on the megabase domains of replicated centromere DNA is shown to require passage through mitosis but not microtubule attachment. Very surprisingly, assembly and stabilization of new CENP-A-containing nucleosomes is restricted exclusively to the subsequent G1 phase, demonstrating direct coupling between progression through mitosis and assembly/maturation of the next generation of centromeres.


Figures

Figure 1.
Figure 1.
Principle of SNAP tag–based pulse labeling. (A and B) Schematic of labeling strategies for pulse-chase labeling (A) or quench-chase-pulse labeling (B) of CENP-A–SNAP fusion protein with BG (BG-block; quench) or TMR-Star (pulse). (C) The SNAP tag can be efficiently labeled in vivo using fluorescent TMR-Star (top) and quenched using nonfluorescent BG (bottom). CENP-A–SNAP cells were labeled with TMR-Star for 15 min or were treated with BG-block for 30 min before TMR-Star labeling and processing for immunofluorescence with anti-HA. (D) TMR-Star–labeled CENP-A–SNAP is centromere localized. Cells were TMR-Star labeled for 15 min and processed for immunofluorescence with anti–CENP-C.
Figure 2.
Figure 2.
CENP-A turnover at centromeres. (A) Outline of cell synchronization and labeling regimen for CENP-A turnover. Cells were synchronized and labeled as depicted followed by fixation and immunofluorescence with anti-HA. Representative images for each time point are shown. After one and two cell cycles, pulse chase–labeled CENP-A–SNAP remaining was detected (insets after two cell cycles [50 h] are magnified an additional 3× and intensity scaled to visualize remaining centromere fluorescence). (B) Quantification of mean TMR-Star intensity at indicated time points. Reduction of signal at each division became apparent in mitosis, during which sister centromeres split and can be resolved individually. A minimum of 500 centromeres in 10 different cells were quantified for each measurement. Error bars represent SEM of centromere intensity. AU, arbitrary units.
Figure 3.
Figure 3.
CENP-A loading initiates in telophase/early G1. (A) Schematic of cell synchronization and labeling protocol. Cell cycle stages are estimates based on time elapsed after release from double thymidine–induced arrest at G1–S. Representative images for each time point are shown. (B) Different stages of mitosis are shown at 11 h after thymidine release. (C) Percentages of cells positive for TMR-Star fluorescence at indicated time points (with estimated cell cycle stage below) after release from thymidine. Numbers in parentheses represent the number of cells counted for each time point. (D and E) Live-cell time lapse of CENP-A–SNAP assembly at centromeres in early G1. (D) Schematic of cell synchronization and labeling protocol for live-cell time-lapse imaging of CENP-A–SNAP assembly at centromeres in early G1. CENP-A–SNAP cells were transiently transfected with YFP–CENP-C–expressing construct 48 h before SNAP-labeling regimen. (E) Representative stills of a metaphase cell exiting mitosis and assembling CENP-A–SNAP across an ∼4-h time course (Video 1, available at http://www.jcb.org/cgi/content/full/jcb.200701066/DC1). A portion of TMR-Star dye is nonspecifically retained near the cell periphery (presumably in internal membranes; white arrows), but no TMR-Star signal is detected at centromeres at this time (colocalizing with YFP–CENP-C [red boxes]). Time points are with respect to anaphase onset. Boxed regions highlight the initial absence of CENP-A–SNAP at centromeres and its earliest detection by 50 min after anaphase onset and continued assembly out to 260 min. All images are equally depth scaled across time.
Figure 4.
Figure 4.
Nascent CENP-A loads exclusively during G1. (A) Schematic of cell synchronization and late G1 labeling protocol. (B) Representative images at indicated time points. Percentages of cells that have loaded CENP-A are indicated below. Note that the 11% of cells that have loaded CENP-A by 9.5 h represent cells that have already entered the next G1 phase, as evident from the absence of CENP-A loading in cells blocked in mitosis by nocodazole.
Figure 5.
Figure 5.
Centromeric levels of endogenous CENP-A increases during G1 phase. (A) HeLa cells stably expressing YFP–CENP-A (Kops et al., 2004) or parental HeLa cells were synchronized by tandem treatments with thymidine and released, and cells in mitosis or at the G1–S boundary were either imaged directly (YFP fluorescence) in live cells or processed for indirect immunofluorescence with anti–CENP-A (cell cycle times not drawn to scale). (B) Quantification of mean CENP-A intensity. For YFP–CENP-A, >600 centromeres from >10 cells, and for endogenous CENP-A, >200 centromeres from five different cells were quantified for each measurement. Error bars represents SEM of centromere intensity. AU, arbitrary units.
Figure 6.
Figure 6.
Passage through mitosis is critical for CENP-A loading in early G1. (A) Schematic of cell synchronization, labeling, and PEG-mediated cell–cell fusion protocol. CENP-A–SNAP cells marked with H3-CFP or CFP-tubulin were sequentially released from a double thymidine block, whereas prior assembled CENP-A–SNAP was quenched. At the time of PEG-mediated fusion H3-CFP and CFP-tubulin cells were in G1 or G2 at the indicated frequencies based on the fraction of cells that had loaded CENP-A–SNAP. After PEG fusion, nocodazole was added to prevent any additional passage through mitosis, and CENP-A–SNAP loading in binucleate heterokaryons was determined after 4 additional hours by TMR-Star labeling. (B) Representative images of binucleate heterokaryons double labeled with H3-CFP and CFP-tubulin, in which both, one, or none of the nuclei has assembled CENP-A–SNAP at centromeres. (C) Frequency of binucleate heterokaryons in which both, one, or none of the nuclei have loaded CENP-A–SNAP at centromeres (TMR-positive nuclei) in fusions of the indicated populations. Arrows in bar graph for G2–G1 cell fusion experiment represent the fraction of H3-CFP cells that were in G1 phase (red) or G2 phase (blue) at the time of fusion. At least 30 binucleate heterokaryons were analyzed in each experiment.
Figure 7.
Figure 7.
Microtubule attachment in mitosis is not required for CENP-A assembly at centromeres. (A) Schematic of cell synchronization, transfection, and labeling protocol. (B) Representative image of cells transiently transfected with a transcription-mediated BubR1 RNAi gene during late S/G2 phase, after which cells were arrested again with thymidine. After quenching CENP-A–SNAP with BG, thymidine inhibition was released, followed by addition of nocodazole to block spindle microtubule assembly. Newly made CENP-A–SNAP was pulse labeled with TMR-Star in the subsequent S/G2 (8 h after release from thymidine). 15 h after thymidine release, two of three cells (1 and 2) were premitotic (based on the centromere number consistent with unresolved sister centromere pairs) and had not loaded CENP-A–SNAP, whereas the third cell had exited mitosis without chromosome segregation and cytokinesis (centromere number consistent with an 8N DNA content in which sister centromeres are resolved) and had loaded CENP-A–SNAP. Centromere number per cell is indicated in the HA image. (C) Percentages of cells that had loaded CENP-A after the manipulations in A with the siRNAs as indicated. Bracketed numbers represent number of cells counted for each condition. (D) Frequency distribution of centromere numbers for cells with (TMR positive; red) or without (TMR negative; blue) CENP-A loading.
Figure 8.
Figure 8.
Schematic depicting centromeric chromatin composition in relation to the cell cycle. CENP-A–containing nucleosomes (red) are interspersed with canonical H3-containing nucleosomes (green) after replication in S phase, and this mixed set of nucleosomes is the substrate for nucleating kinetochore assembly in mitosis and is maintained as cells exit in anaphase. CENP-A assembly initiates in telophase and proceeds through early G1 (presumably concurrent with removal of H3 nucleosomes). CENP-A– and H3-containing nucleosomes are stylized as single nucleosomes but may represent continuous alternating arrays of one or the other type. In mitosis, CENP-A nucleosomes may coalesce to form a rigid interface for kinetochore formation as proposed previously (Zinkowski et al., 1991; Blower et al., 2002; Black et al., 2004, ,b).

Comment in

  • Centromeric chromatin gets loaded.
    Carroll CW, Straight AF. Carroll CW, et al. J Cell Biol. 2007 Mar 12;176(6):735-6. doi: 10.1083/jcb.200702020. Epub 2007 Mar 5. J Cell Biol. 2007. PMID: 17339381 Free PMC article.

References

    1. Ahmad, K., and S. Henikoff. 2002. Histone H3 variants specify modes of chromatin assembly. Proc. Natl. Acad. Sci. USA. 99(Suppl. 4):16477–16484. - PMC - PubMed
    1. Amor, D.J., and K.H. Choo. 2002. Neocentromeres: role in human disease, evolution, and centromere study. Am. J. Hum. Genet. 71:695–714. - PMC - PubMed
    1. Amor, D.J., K. Bentley, J. Ryan, J. Perry, L. Wong, H. Slater, and K.H. Choo. 2004. a. Human centromere repositioning “in progress.” Proc. Natl. Acad. Sci. USA. 101:6542–6547. - PMC - PubMed
    1. Amor, D.J., P. Kalitsis, H. Sumer, and K.H. Choo. 2004. b. Building the centromere: from foundation proteins to 3D organization. Trends Cell Biol. 14:359–368. - PubMed
    1. Black, B.E., D.R. Foltz, S. Chakravarthy, K. Luger, V.L. Woods Jr., and D.W. Cleveland. 2004. Structural determinants for generating centromeric chromatin. Nature. 430:578–582. - PubMed

Publication types

MeSH terms