. 2007 Mar 15;178(6):3695-701.
doi: 10.4049/jimmunol.178.6.3695.

Induction of protective immunity to Listeria monocytogenes in neonates

Affiliations

Induction of protective immunity to Listeria monocytogenes in neonates

Tobias R Kollmann et al. J Immunol. .

Abstract

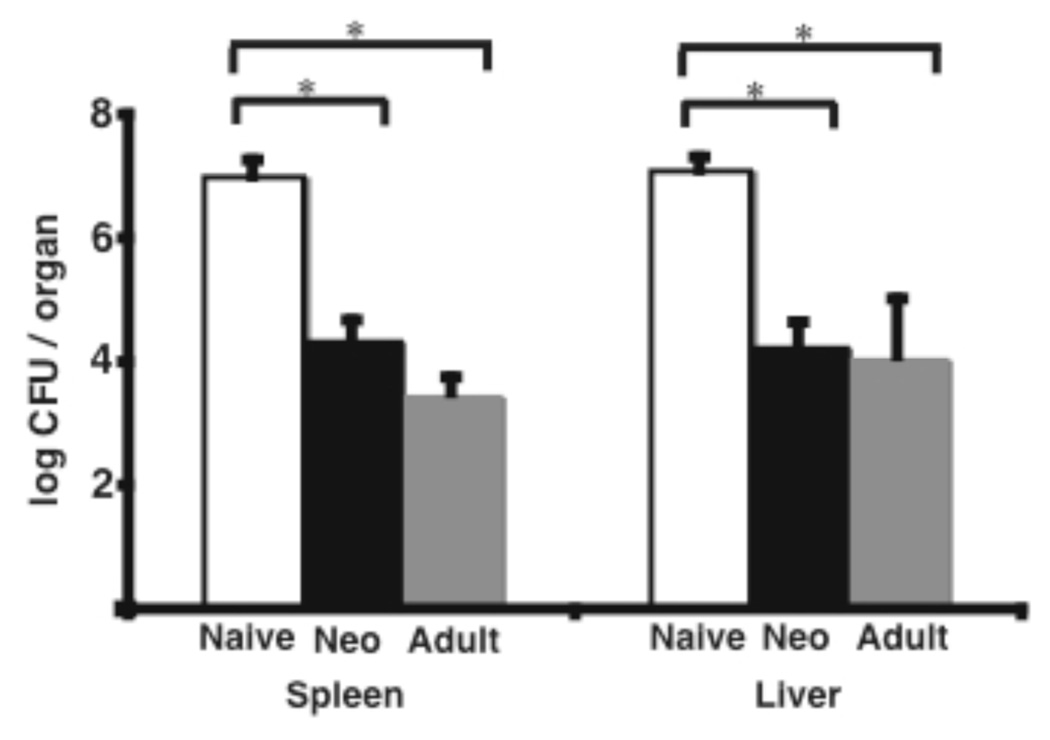
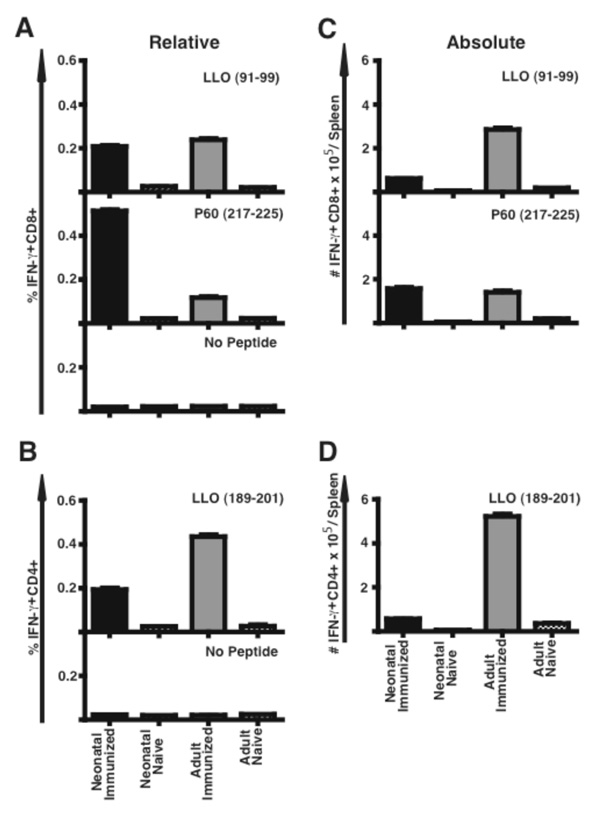
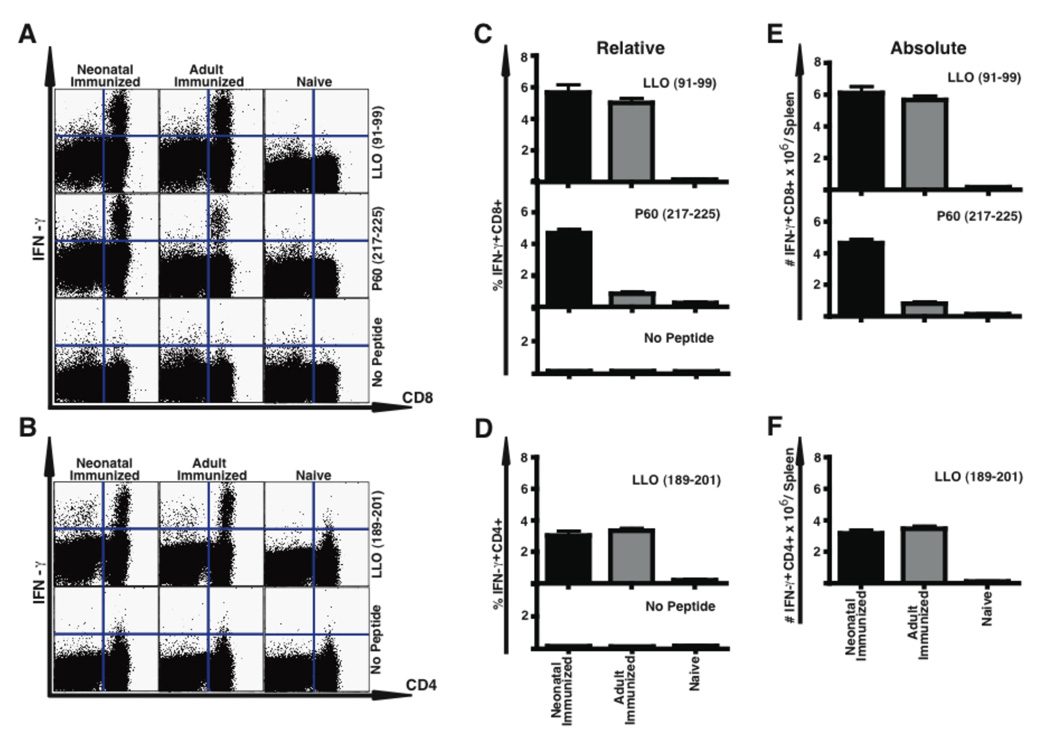
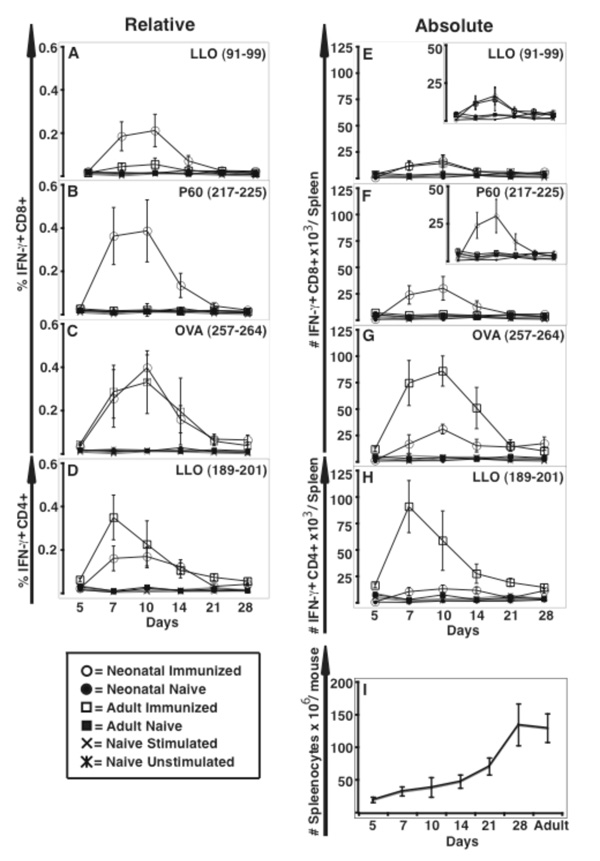
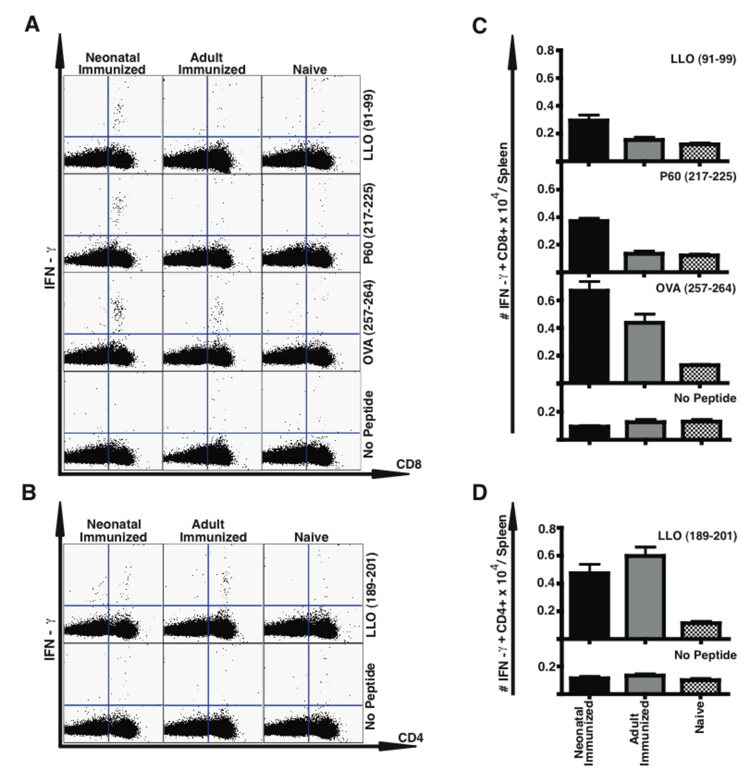
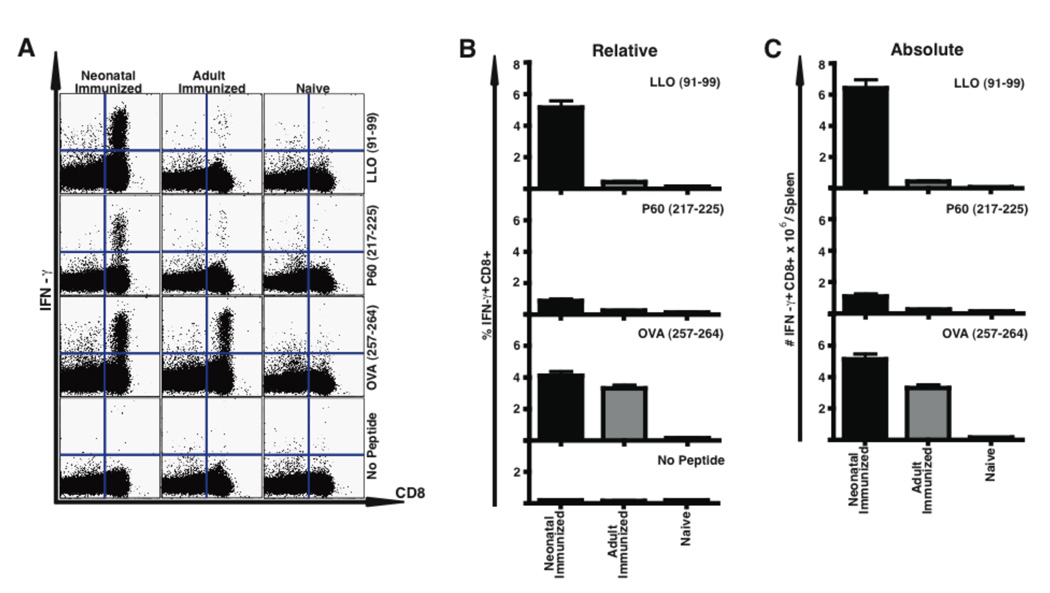
Neonates suffer unduly from infections and also respond suboptimally to most commonly used vaccines. However, a CD8 T cell response can be elicited in neonates if the Ag is introduced into the cytoplasm of APCs. Listeria monocytogenes (Lm) targets the cytoplasm of APC and is a strong CD8 and CD4 Th1-promoting vaccine vehicle in adult mice. We hypothesized that an attenuated strain of Lm would be safe and induce long-lasting protective immunity, even in neonates. We found that neonatal mice immunized only once with the attenuated strain DeltaactA-Lm developed robust primary and secondary CD8 and CD4 Th1 responses and were fully protected from lethal challenge with virulent wild-type Lm without the need for a booster immunization. Furthermore, DeltaactA-Lm expressing a heterologous recombinant Ag induced a strong CD8 and Th1 memory response to that Ag. Based on these data, we propose that DeltaactA-Lm or derivatives thereof might serve as a vaccine vehicle for neonatal immunization.


Figures

Figure 1
Figure 1
Neonatally immunized mice were protected from wild-type Lm challenge to the same degree as mice immunized as adults. Mice immunized with 1×10⁴ CFU i.p. of ΔactA-Lm on day 5 of life (Neo, black bar) or at 6 weeks of age (Adult, grey bar), or age matched non-immune (Naïve, white bar) mice, were infected i.v. with 1×10⁵ CFU of wild-type Lm three months after immunization. Lm CFUs in the spleens or livers of mice 3 days after infection were determined and shown is the mean from a total of 12 mice per group combined from three separate experiments. Bar = SE; * = statistically significant with p < 0.05.
Figure 2
Figure 2
Neonatally immunized mice develop an Lm-specific primary CD8 and CD4 T cell response. Spleen cells were obtained from the indicated mice 7 days after infection with ΔactA-Lm, and stimulated with the indicated MHC class I- or class II-restricted Lm-specific peptides prior to analysis of intracellular cytokine expression by flow cytometry. Shown is the mean percentage (A, B) or total number/spleen (C, D) of CD8 (A, C) or CD4 (B, D) IFN-γ producing splenocytes. For each group the percentage of unstimulated IFN-γ producing control cells is shown for CD4 or CD8, and the numbers of these cells were subtracted from the absolute numbers of antigen-specific cells shown (C, D). These data represent five mice per group from two combined experiments. Bar = SE.
Figure 3
Figure 3
Neonatally immunized mice develop an Lm-specific secondary CD8 and CD4 T cell response. Mice immunized with 1×10⁴ CFU i.p. of ΔactA-Lm on day 5 of life (Neonate) or at 6 weeks of age (Adult) were infected i.v. with 1×10⁵ CFU of wild-type Lm three months after immunization. Spleen cells were obtained from indicated mice 5 days after infection along with age matched non-immune (Naïve) splenocytes, and stimulated with the indicated MHC class I- or class II-restricted Lm-specific peptides prior to analysis of intracellular cytokine expression by flow cytometry. Shown in (A) for CD8 and in (B) for CD4 are examples of the flow cytometric analysis, and in the other panels the mean percentage (C, D) and total number/spleen (E, F) of CD8 (C, E) or CD4 (D, F) IFN-γ producing splenocytes are shown. For each group unstimulated IFN-γ producing controls are shown in the examples, as well as in the summary graphs for CD4 or CD8, and the numbers of these cells were subtracted from the absolute numbers of antigen-specific cells shown (C–F). The data in C–F represent five mice per group from two combined experiments. Bar = SE.
Figure 4
Figure 4
Neonatally immunized mice develop an Lm- and OVA-specific primary CD8 T cell response. Spleen cells were obtained from the indicated mice 5-, 7-, 10-, 14, 21-, or 28- days after infection with ΔactA-Lm-OVA, and stimulated with the indicated MHC class I-restricted Lm- or OVA-specific peptides prior to analysis of intracellular cytokine expression by flow cytometry. Shown are the mean percentage (A–D) and total number/spleen (E–H) of CD8 (A–C, E–G) or CD4 (D, H) IFN-γ producing splenocytes. Naïve age-matched mice and unstimulated controls are included in each graph. The insert in (E) and (F) show the same data, but on a smaller scale than the main Figure for better visualization. (I) shows the total number of splenocytes for each age group. These data represent five to ten mice per age group from two combined experiments. Bar = SE.
Figure 5
Figure 5
Neonatally immunized mice develop an Lm- and OVA-specific memory T cell response. Spleen cells were obtained from the indicated mice after completion of the contraction phase at 28 days after infection with ΔactA-Lm-OVA, and stimulated with the indicated MHC class I-restricted Lm- or OVA-specific peptides prior to analysis of intracellular cytokine expression by flow cytometry. Shown in (A) for CD8 and in (B) for CD4 are examples of the flow cytometric analysis; the other panels show the mean total number/spleen of CD8 (C) or CD4 (D) IFN-γ producing splenocytes. For each group unstimulated IFN-γ producing controls are shown in the examples, as well as in the summary graphs for CD4 or CD8. The data represent five mice per group. Bar = SE.
Figure 6
Figure 6
Neonatally immunized mice develop an Lm- and OVA-specific secondary CD8 T cell response. Mice immunized with 1×10⁴ CFU i.p. of ΔactA-Lm-OVA on day 5 of life (Neonate) or at 6 weeks of age (Adult) were infected i.v. with 1×10⁵ CFU of wild-type Lm-OVA three months after immunization. Spleen cells were obtained from the indicated mice 5 days after infection along with age matched non-immune (Naïve) splenocytes, and stimulated with the indicated MHC class I-restricted Lm- or OVA-specific peptides prior to analysis of intracellular cytokine expression by flow cytometry. Shown in (A) are examples of the flow cytometric analysis. Figures B shows the mean percentage, and Figure C the total number/spleen of CD8 IFN-γ-producing splenocytes. For each group unstimulated IFN-γ producing controls are shown in the examples, as well as in the summary graphs (B), and the numbers of these cells were subtracted from the absolute numbers of antigen-specific cells shown. The data represent five mice per group from two combined experiments. Bar = SE.

References

    1. Siegrist CA. Neonatal and early life vaccinology. Vaccine. 2001;19:3331–3346. - PubMed
    1. Marchant A, Goldman M. T cell-mediated immune responses in human newborns: ready to learn? Clin. Exp. Immunol. 2005;141:10–18. - PMC - PubMed
    1. Adkins B, Leclerc C, Marshall-Clarke S. Neonatal adaptive immunity comes of age. Nat. Rev. Immunol. 2004;4:553–564. - PubMed
    1. Li L, Lee HH, Bell JJ, Gregg RK, Ellis JS, Gessner A, Zaghouani H. IL-4 utilizes an alternative receptor to drive apoptosis of Th1 cells and skews neonatal immunity toward Th2. Immunity. 2004;20:429–440. - PubMed
    1. Adkins B, Bu Y, Guevara P. Murine neonatal CD4+ lymph node cells are highly deficient in the development of antigen-specific Th1 function in adoptive adult hosts. J. Immunol. 2002;169:4998–5004. - PubMed

Publication types

MeSH terms