. 2007 Apr;150(8):1031-43.
doi: 10.1038/sj.bjp.0707189. Epub 2007 Mar 5.

Methyl succinate antagonises biguanide-induced AMPK-activation and death of pancreatic beta-cells through restoration of mitochondrial electron transfer

Affiliations

Methyl succinate antagonises biguanide-induced AMPK-activation and death of pancreatic beta-cells through restoration of mitochondrial electron transfer

S A Hinke et al. Br J Pharmacol. 2007 Apr.

Abstract

Background and purpose: Two mechanisms have been proposed to explain the insulin-sensitising properties of metformin in peripheral tissues: (a) inhibition of electron transport chain complex I, and (b) activation of the AMP activated protein kinase (AMPK). However the relationship between these mechanisms and their contribution to beta-cell death and dysfunction in vitro, are currently unclear.

Experimental approach: The effects of biguanides (metformin and phenformin) were tested on MIN6 beta-cells and primary FACS-purified rat beta-cells. Cell metabolism was assessed biochemically and by FACS analysis, and correlated with AMPK phosphorylation state and cell viability, with or without fuel substrates.

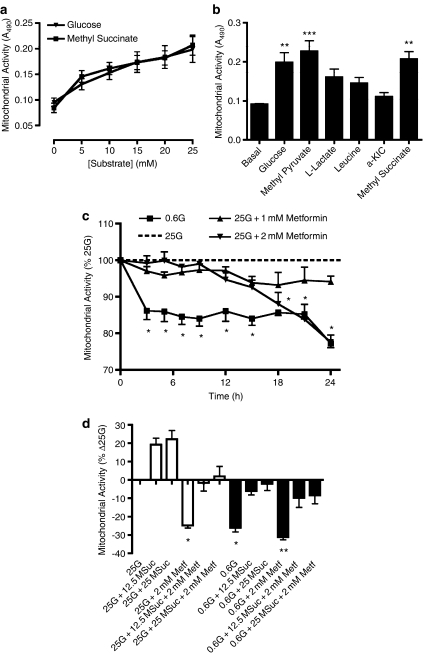
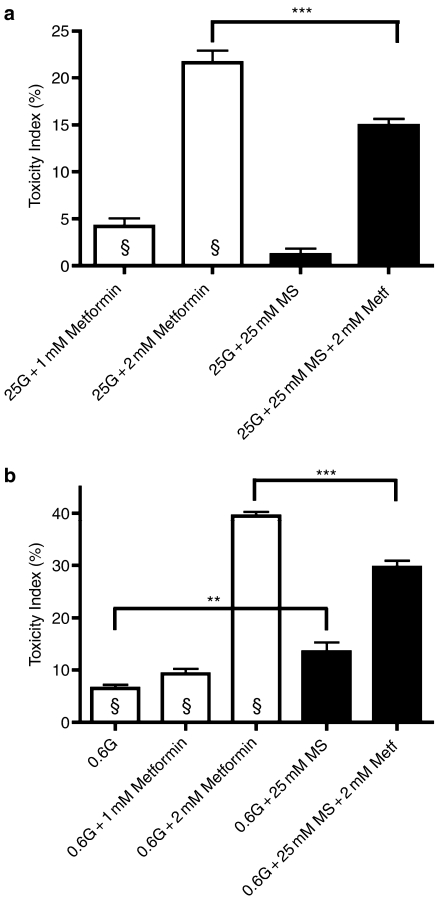
Key results: In MIN6 cells, metformin reduced mitochondrial complex I activity by up to 44% and a 25% net reduction in mitochondrial reducing potential. In rat beta-cells, metformin caused NAD(P)H accumulation above maximal glucose-inducible levels, mimicking the effect of rotenone. Drug exposure caused phosphorylation of AMPK on Thr(172) in MIN6 cell extracts, indicative of kinase activation. Methyl succinate, a complex II substrate, appeared to bypass metformin blockade of complex I. This resulted in reduced phosphorylation of AMPK, establishing a link between biguanide-induced mitochondrial inhibition and AMPK activation. Corresponding assessment of cell death indicated that methyl succinate decreased biguanide toxicity to beta-cells in vitro.

Conclusions and implications: AMPK activation can partly be attributed to metformin's inhibitory action on mitochondrial complex I. Anaplerotic fuel metabolism via complex II rescued beta-cells from metformin-associated toxicity. We propose that utilisation of anaplerotic nutrients may reconcile in vitro and in vivo effects of metformin on the pancreatic beta-cell.


Figures

Figure 1
Figure 1
Effects of metformin on β-cell oxidative metabolism. (a) Direct measurements of complex I (NADH:Ubiquinone oxidoreductase) activity of the electron transport chain (black bars) or mitochondrial citrate synthase (cross-hatched bars) were made in extracts of MIN6 cells, cultured for 12 h in the presence or absence of metformin or phenformin. Citrate synthase assays were performed to confirm the specificity of the biguanide inhibition and to eliminate the possibility of change in mitochondrial mass. (b) Lactate accumulation in MIN6 cell media as a function of metformin concentration and duration of exposure. (c) LDH activity measured in MIN6 extracts cultured in the presence or absence of metformin. (d) LDH activity in MIN6 cells was 8–17 times lower than that measured in control mouse tissues (heart, kidney and liver). Data represent mean±s.e.m. of at least three independent experiments. *P<0.05; P<0.05 vs 0.6G alone.
Figure 2
Figure 2
MIN6 cell mitochondrial activity measured using the MTT reduction assay. (a) Acute concentration response curves for glucose and methyl succinate stimulating mitochondrial activity in MIN6 cells. (b) Acute stimulation of mitochondrial activity by 25 mM of various fuels in MIN6 cells. (c) Time dependent inhibition of MIN6 cell mitochondrial activity by glucose deprivation or addition of metformin. (d) Stimulation of mitochondrial activity by methyl succinate (12.5 or 25 mM) in the presence or absence of glucose and/or metformin (1 or 2 mM) during 24 h exposure of MIN6 cells. In all experiments, MTT was added to cell culture wells 2 h before the end point, and treated as per described in the Methods section. Data are mean±s.e.m. (n⩾4); *P<0.05, **P<0.01, ***P<0.001.
Figure 3
Figure 3
Concentration-dependent induction of MIN6 AMPK phosphorylation state by metformin, in the presence and absence of methyl succinate, cultured in media containing 25 mM glucose. (a) Representative Western blots from protein extracts (25 μg per lane) taken from MIN6 cells cultured 24 h under the given conditions. Immunoblots were performed under standard conditions as described in the Methods section. (b) Compiled densitometric analysis of Western blots ((P)Thr172AMPK, clear bars; total AMPK, black bars). Data are the mean±s.e.m. of pixel density scans from 5–7 bands for each condition, from independent protein extracts. §P<0.05 vs 25G alone; *P<0.01 comparing 25G+2 mM metformin to the same condition with 25 mM methyl succinate.
Figure 4
Figure 4
Concentration-dependent induction of MIN6 AMPK phosphorylation state by metformin, in the presence and absence of methyl succinate, cultured in media containing 0.6 mM glucose. (a) Representative Western blots from protein extracts (25 μg per lane) taken from MIN6 cells cultured 24 h under the given conditions. Immunoblots were performed under standard conditions as described in the Methods section. (b) Compiled densitometric analysis of Western blots ((P)Thr172AMPK, clear bars; total AMPK, black bars). Data are the mean±s.e.m. of pixel density scans from 5–6 bands for each condition, from independent protein extracts. §P<0.05 vs 25G alone; *P<0.01 comparing 0.6G+2 mM metformin to the same condition supplemented with 25 mM methyl succinate.
Figure 5
Figure 5
MIN6 cell viability by Trypan blue exclusion cytometry following 24 h culture under the given conditions. (a) Toxicity index of 1 or 2 mM metformin, for MIN6 cells cultured in the presence of 25 mM glucose and/or methyl succinate. (b) Toxicity index as in (a), but with MIN6 cells cultured in media without added glucose (0.6 mM). Toxicity index was calculated as described in the text. Data are mean±s.e.m. for seven independent trials. §P<0.01 vs control 25G, **P<0.01, ***P<0.001.
Figure 6
Figure 6
Metabolic redox state and viability of primary rat β-cells when exposed to biguanides. (a) Effect of metformin (Metf) or (b) phenformin (Phenf) on cellular NAD(P)H in 10 mM glucose-stimulated rat β-cells. Cells were incubated for 1.5 h (clear bars) or 3 h (black bars) under the indicated conditions as specified in Methods section, followed by FACS-measurement of total cellular NAD(P)H in intact (propidium iodide-negative) cells. Rotenone (100 nM) was added 5 min before FACS analysis. Changes in β-cell NAD(P)H induced by 0–20 mM glucose in the absence of biguanides are also shown (a); data in (b) were collected in 10 mM glucose-exposed β-cells. Data represent mean fluorescence intensities (MFI, mean±s.e.m., n=7), expressed as %MFI measured in 10 mM glucose-stimulated, untreated cells; * indicates significant (P<0.01) effect of biguanides relative to control cells. (c) Rat β-cells were exposed for 72 h to phenformin or metformin, both in the presence of 10 mM glucose and their survival compared to cells that were maintained in low glucose (Glc, 3 mM), in the absence of biguanides. These incubations were carried out in standard culture media (black bars), or in media supplemented with 10 mM methyl pyruvate (MPyr, 10 mM, cross-hatched bars) or 10 mM methyl succinate (MSuc, 10 mM, clear bars). Data represent mean±s.e.m. (n=5) Toxicity Indices, reflecting the amount of apoptotic beta cells under the indicated condition, *indicates significant (P<0.01) effect of MSuc or MPyr as compared to cells cultured in standard medium (black bars).

References

    1. Abbud W, Habinowski S, Zhang JZ, Kendrew J, Elkairi FS, Kemp BE, et al. Stimulation of AMP-activated protein kinase (AMPK) is associated with enhancement of Glut1-mediated glucose transport. Arch Biochem Biophys. 2000;380:347–352. - PubMed
    1. Abramson E, Arky RA. Treatment of the obese diabetic. A comparative study of placebo, sulfonylurea and phenformin. Metabolism. 1967;16:204–212. - PubMed
    1. Ainscow EK, Zhao C, Rutter GA. Acute overexpression of lactate dehydrogenase-A perturbs beta-cell mitochondrial metabolism and insulin secretion. Diabetes. 2000;49:1149–1155. - PubMed
    1. Bennett BD, Jetton TL, Ying G, Magnuson MA, Piston DW. Quantitative subcellular imaging of glucose metabolism within intact pancreatic islets. J Biol Chem. 1996;271:3647–3651. - PubMed
    1. Bergmeyer H, Bernt E.Lactate dehydrogenase: UV-assay with pyruvate and NADH Methods of Enzymatic Analysis 1974Verlag Chemie Weinheim, Academic Press, Inc.: New York; 574–579.In: Bergmeyer H (ed)

Publication types

MeSH terms