

Calorie restriction increases muscle mitochondrial biogenesis in healthy humans
- PMID: 17341128
- PMCID: PMC1808482
- DOI: 10.1371/journal.pmed.0040076
Calorie restriction increases muscle mitochondrial biogenesis in healthy humans
Abstract
Background: Caloric restriction without malnutrition extends life span in a range of organisms including insects and mammals and lowers free radical production by the mitochondria. However, the mechanism responsible for this adaptation are poorly understood.
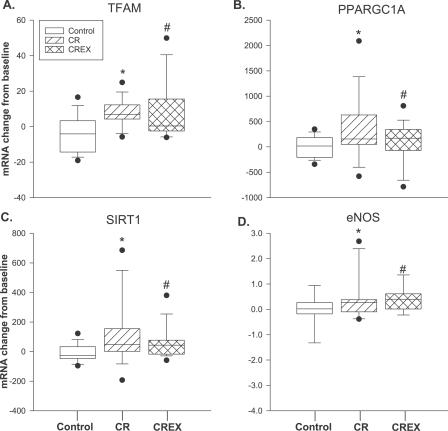
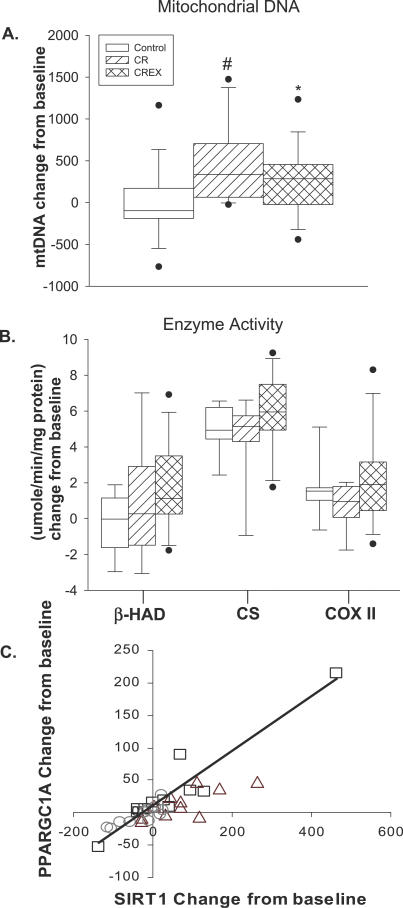
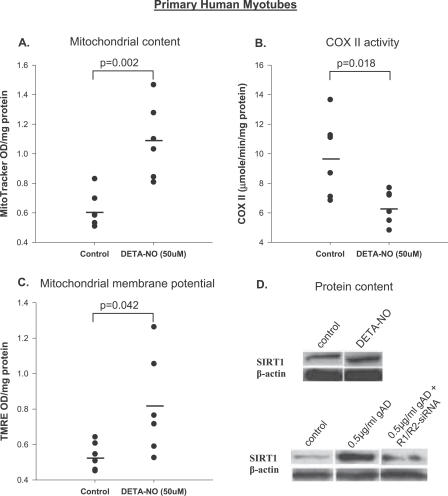
Methods and findings: The current study was undertaken to examine muscle mitochondrial bioenergetics in response to caloric restriction alone or in combination with exercise in 36 young (36.8 +/- 1.0 y), overweight (body mass index, 27.8 +/- 0.7 kg/m(2)) individuals randomized into one of three groups for a 6-mo intervention: Control, 100% of energy requirements; CR, 25% caloric restriction; and CREX, caloric restriction with exercise (CREX), 12.5% CR + 12.5% increased energy expenditure (EE). In the controls, 24-h EE was unchanged, but in CR and CREX it was significantly reduced from baseline even after adjustment for the loss of metabolic mass (CR, -135 +/- 42 kcal/d, p = 0.002 and CREX, -117 +/- 52 kcal/d, p = 0.008). Participants in the CR and CREX groups had increased expression of genes encoding proteins involved in mitochondrial function such as PPARGC1A, TFAM, eNOS, SIRT1, and PARL (all, p < 0.05). In parallel, mitochondrial DNA content increased by 35% +/- 5% in the CR group (p = 0.005) and 21% +/- 4% in the CREX group (p < 0.004), with no change in the control group (2% +/- 2%). However, the activity of key mitochondrial enzymes of the TCA (tricarboxylic acid) cycle (citrate synthase), beta-oxidation (beta-hydroxyacyl-CoA dehydrogenase), and electron transport chain (cytochrome C oxidase II) was unchanged. DNA damage was reduced from baseline in the CR (-0.56 +/- 0.11 arbitrary units, p = 0.003) and CREX (-0.45 +/- 0.12 arbitrary units, p = 0.011), but not in the controls. In primary cultures of human myotubes, a nitric oxide donor (mimicking eNOS signaling) induced mitochondrial biogenesis but failed to induce SIRT1 protein expression, suggesting that additional factors may regulate SIRT1 content during CR.
Conclusions: The observed increase in muscle mitochondrial DNA in association with a decrease in whole body oxygen consumption and DNA damage suggests that caloric restriction improves mitochondrial function in young non-obese adults.
Conflict of interest statement
Figures
References
-
- Weindruch R, Naylor PH, Goldstein AL, Walford RL. Influences of aging and dietary restriction on serum thymosin alpha 1 levels in mice. J Gerontol. 1988;43:B40–42. - PubMed
-
- Ames BN, Shigenaga MK, Hagen TM. Mitochondrial decay in aging. Biochim Biophys Acta. 1995;1271:165–170. - PubMed
-
- Nicholls DG. Mitochondrial membrane potential and aging. Aging Cell. 2004;3:35–40. - PubMed
-
- Bevilacqua L, Ramsey JJ, Hagopian K, Weindruch R, Harper ME. Effects of short- and medium-term calorie restriction on muscle mitochondrial proton leak and reactive oxygen species production. Am J Physiol Endocrinol Metab. 2004;286:E852–861. - PubMed
-
- Bevilacqua L, Ramsey JJ, Hagopian K, Weindruch R, Harper ME. Long-term caloric restriction increases UCP3 content but decreases proton leak and reactive oxygen species production in rat skeletal muscle mitochondria. Am J Physiol Endocrinol Metab. 2005;289:E429–438. - PubMed
Publication types
MeSH terms
Substances
Grants and funding
LinkOut - more resources
Full Text Sources
Other Literature Sources
Medical
