

QuantiSNP: an Objective Bayes Hidden-Markov Model to detect and accurately map copy number variation using SNP genotyping data
- PMID: 17341461
- PMCID: PMC1874617
- DOI: 10.1093/nar/gkm076
QuantiSNP: an Objective Bayes Hidden-Markov Model to detect and accurately map copy number variation using SNP genotyping data
Abstract
Array-based technologies have been used to detect chromosomal copy number changes (aneuploidies) in the human genome. Recent studies identified numerous copy number variants (CNV) and some are common polymorphisms that may contribute to disease susceptibility. We developed, and experimentally validated, a novel computational framework (QuantiSNP) for detecting regions of copy number variation from BeadArray SNP genotyping data using an Objective Bayes Hidden-Markov Model (OB-HMM). Objective Bayes measures are used to set certain hyperparameters in the priors using a novel re-sampling framework to calibrate the model to a fixed Type I (false positive) error rate. Other parameters are set via maximum marginal likelihood to prior training data of known structure. QuantiSNP provides probabilistic quantification of state classifications and significantly improves the accuracy of segmental aneuploidy identification and mapping, relative to existing analytical tools (Beadstudio, Illumina), as demonstrated by validation of breakpoint boundaries. QuantiSNP identified both novel and validated CNVs. QuantiSNP was developed using BeadArray SNP data but it can be adapted to other platforms and we believe that the OB-HMM framework has widespread applicability in genomic research. In conclusion, QuantiSNP is a novel algorithm for high-resolution CNV/aneuploidy detection with application to clinical genetics, cancer and disease association studies.
Figures
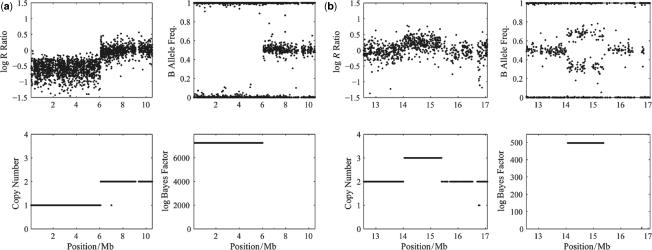
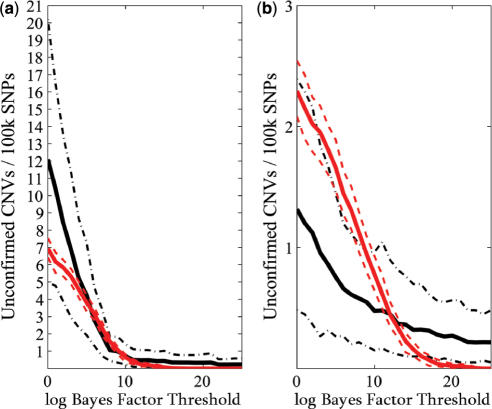
 for the analysis of the (a) Human-1 and (b) HumanHap300 datasets. Sample 10 was excluded from the analysis as this dataset shown unusually high levels of noise. Errors were derived from bootstrap simulations using the empirical and simulated datasets. There appears to be a good matching between the two boundaries for the Human-1 dataset. The comparison using the HumanHap300 data is less favourable, possibly due to the change in number of probes per SNP in versions of the HumanHap300 used in the experiments (see Supplementary Data, Materials and Methods S1 for details).
References
-
- Speicher MR, Carter NP. The new cytogenetics: blurring the boundaries with molecular biology. Nat. Rev. Genet. 2005;6:782–792. - PubMed
-
- Hochstenbach R, Ploos van Amstel HK, Poot M. Microarray-based genome investigation: molecular karyotyping or segmental aneuploidy profiling? Eur. J. Hum. Genet. 2006;14:262–265. - PubMed
-
- Zhao X, Li C, Paez JG, Chin K, Janne PA, Chen TH, Girard L, Minna J, Christiani D, et al. An integrated view of copy number and allelic alterations in the cancer genome using single nucleotide polymorphism arrays. Cancer Res. 2004;64:3060–3071. - PubMed
Publication types
MeSH terms
Grants and funding
LinkOut - more resources
Full Text Sources
Other Literature Sources
Miscellaneous
