

Chromodynamics of cooperation in finite populations
- PMID: 17342204
- PMCID: PMC1803018
- DOI: 10.1371/journal.pone.0000270
Chromodynamics of cooperation in finite populations
Abstract
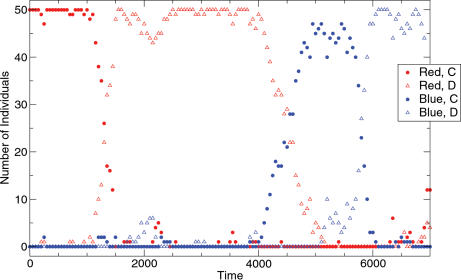
Background: The basic idea of tag-based models for cooperation is that individuals recognize each other via arbitrary signals, so-called tags. If there are tags of different colors, then cooperators can always establish new signals of recognition. The resulting "chromodynamics" is a mechanism for the evolution of cooperation. Cooperators use a secret tag until they are discovered by defectors who then destroy cooperation based on this tag. Subsequently, a fraction of the population manages to establish cooperation based on a new tag.
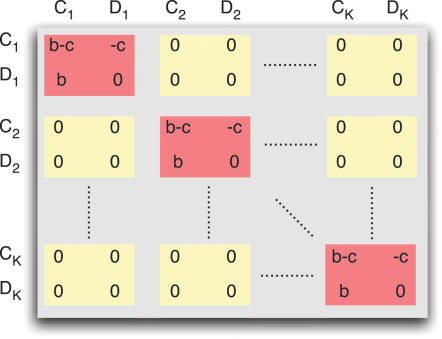
Methodology/principal findings: We derive a mathematical description of stochastic evolutionary dynamics of tag-based cooperation in populations of finite size. Benefit and cost of cooperation are given by b and c. We find that cooperators are more abundant than defectors if b/c > 1+2u/v, where u is the mutation rate changing only the strategy and v is the mutation rate changing strategy and tag. We study specific assumptions for u and v in two genetic models and one cultural model.
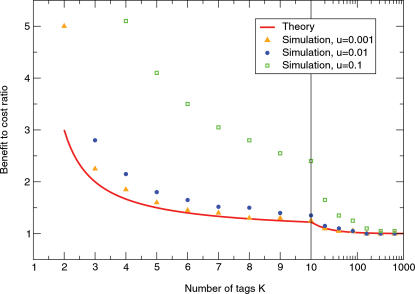
Conclusions/significance: In a genetic model, tag-based cooperation only evolves if a gene encodes both strategy and tag. In a cultural model with equal mutation rates between all possible phenotypes (tags and behaviors), the crucial condition is b/c > (K+1)/(K-1), where K is the number of tags. A larger number of tags requires a smaller benefit-to-cost ratio. In the limit of many different tags, the condition for cooperators to have a higher average abundance than defectors becomes b > c.
Conflict of interest statement
Figures
Similar articles
-
Green-beard effect predicts the evolution of traitorousness in the two-tag Prisoner's dilemma.J Theor Biol. 2011 Nov 7;288:84-91. doi: 10.1016/j.jtbi.2011.07.023. Epub 2011 Aug 2. J Theor Biol. 2011. PMID: 21821051
-
Demographic noise and cost of greenbeard can facilitate greenbeard cooperation.Evolution. 2018 Dec;72(12):2595-2607. doi: 10.1111/evo.13615. Epub 2018 Oct 26. Evolution. 2018. PMID: 30270425
-
Evolution of cooperation in a multidimensional phenotype space.Theor Popul Biol. 2015 Jun;102:60-75. doi: 10.1016/j.tpb.2015.03.007. Epub 2015 Apr 3. Theor Popul Biol. 2015. PMID: 25847145
-
Generous cooperators can outperform non-generous cooperators when replacing a population of defectors.Theor Popul Biol. 2010 Jun;77(4):257-62. doi: 10.1016/j.tpb.2010.03.002. Epub 2010 Mar 10. Theor Popul Biol. 2010. PMID: 20226204
-
Evolutionary dynamics in structured populations.Philos Trans R Soc Lond B Biol Sci. 2010 Jan 12;365(1537):19-30. doi: 10.1098/rstb.2009.0215. Philos Trans R Soc Lond B Biol Sci. 2010. PMID: 20008382 Free PMC article. Review.
Cited by
-
Evolution of in-group favoritism.Sci Rep. 2012;2:460. doi: 10.1038/srep00460. Epub 2012 Jun 21. Sci Rep. 2012. PMID: 22724059 Free PMC article.
-
When do stereotypes undermine indirect reciprocity?PLoS Comput Biol. 2024 Mar 1;20(3):e1011862. doi: 10.1371/journal.pcbi.1011862. eCollection 2024 Mar. PLoS Comput Biol. 2024. PMID: 38427626 Free PMC article.
-
Retrotransposon gag-like 1 (RTL1) and the molecular evolution of self-targeting imprinted microRNAs.Biol Direct. 2019 Oct 22;14(1):18. doi: 10.1186/s13062-019-0250-0. Biol Direct. 2019. PMID: 31640745 Free PMC article.
-
Imperfect vaccine aggravates the long-standing dilemma of voluntary vaccination.PLoS One. 2011;6(6):e20577. doi: 10.1371/journal.pone.0020577. Epub 2011 Jun 8. PLoS One. 2011. PMID: 21687680 Free PMC article.
-
EGTtools: Evolutionary game dynamics in Python.iScience. 2023 Mar 17;26(4):106419. doi: 10.1016/j.isci.2023.106419. eCollection 2023 Apr 21. iScience. 2023. PMID: 37102153 Free PMC article.
References
-
- Hamilton WD. The genetical evolution of social behaviorI and II. J Theor Biol. 1964;7:1–16+ 17–52. - PubMed
-
- Dawkins R. The Selfish Gene. New York: Oxford University Press; 1976.
-
- Hartvigsen G, Worden L, Levin SA. Global cooperation achieved through small behavioral changes among strangers. Complexity. 2000;5:14–19.
-
- Durrett R, Levin SA. Can stable social groups be maintained by homophilous imitation alone? J Econ Behavior & Organization. 2005;57:267–286.
-
- Riolo RL, Cohen MD, Axelrod R. Evolution of cooperation without reciprocity. Nature. 2001;414:441–443. - PubMed
Publication types
MeSH terms
Grants and funding
LinkOut - more resources
Full Text Sources
Other Literature Sources
Medical
