. 2007 May 11;282(19):14316-27.
doi: 10.1074/jbc.M700912200. Epub 2007 Mar 7.

Structure and kinetics of monofunctional proline dehydrogenase from Thermus thermophilus

Affiliations

Structure and kinetics of monofunctional proline dehydrogenase from Thermus thermophilus

Tommi A White et al. J Biol Chem. .

Abstract

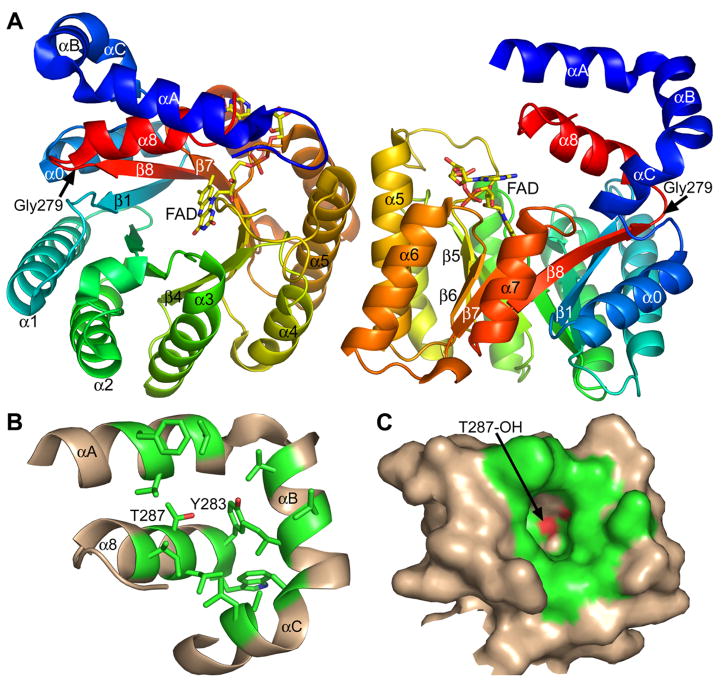
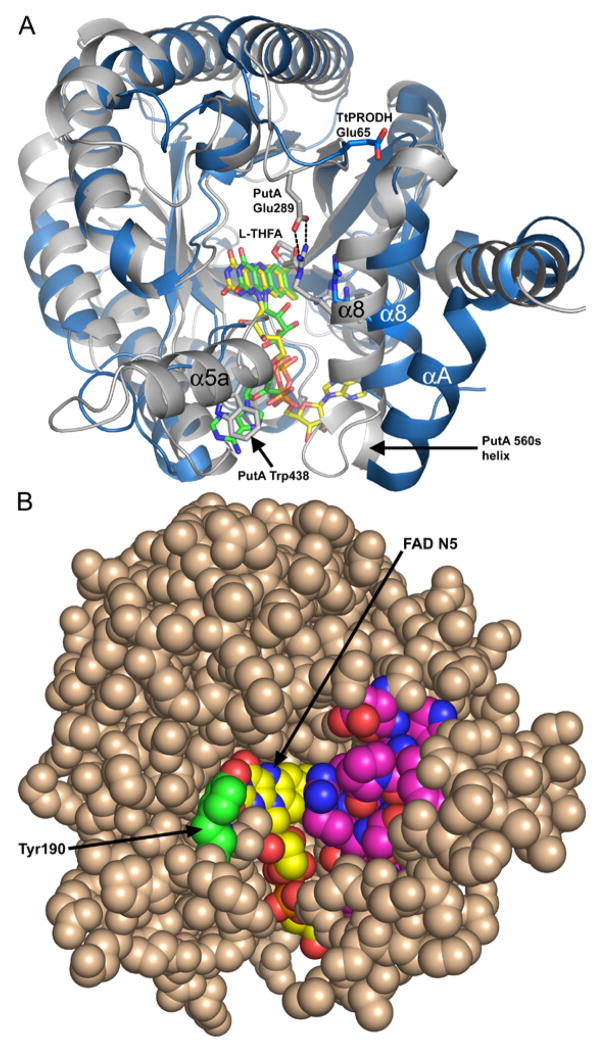
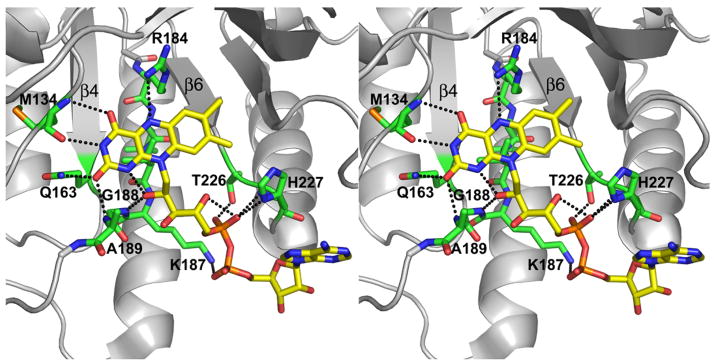
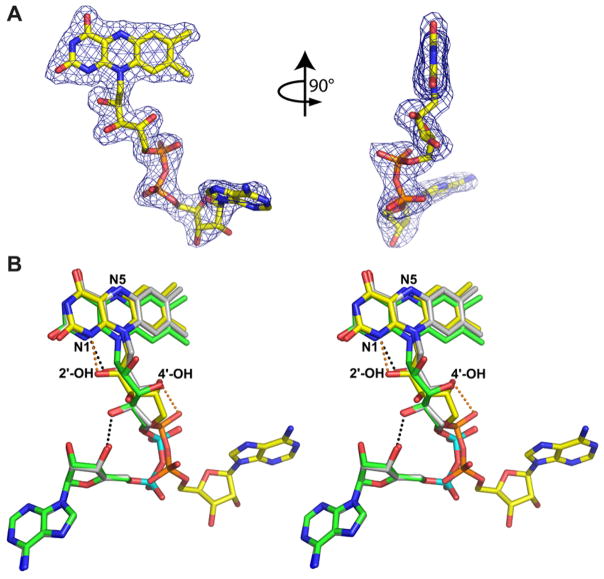
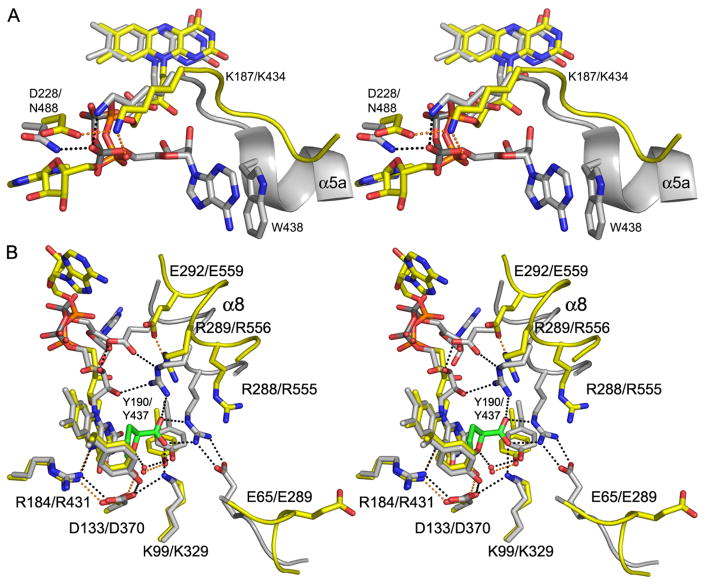
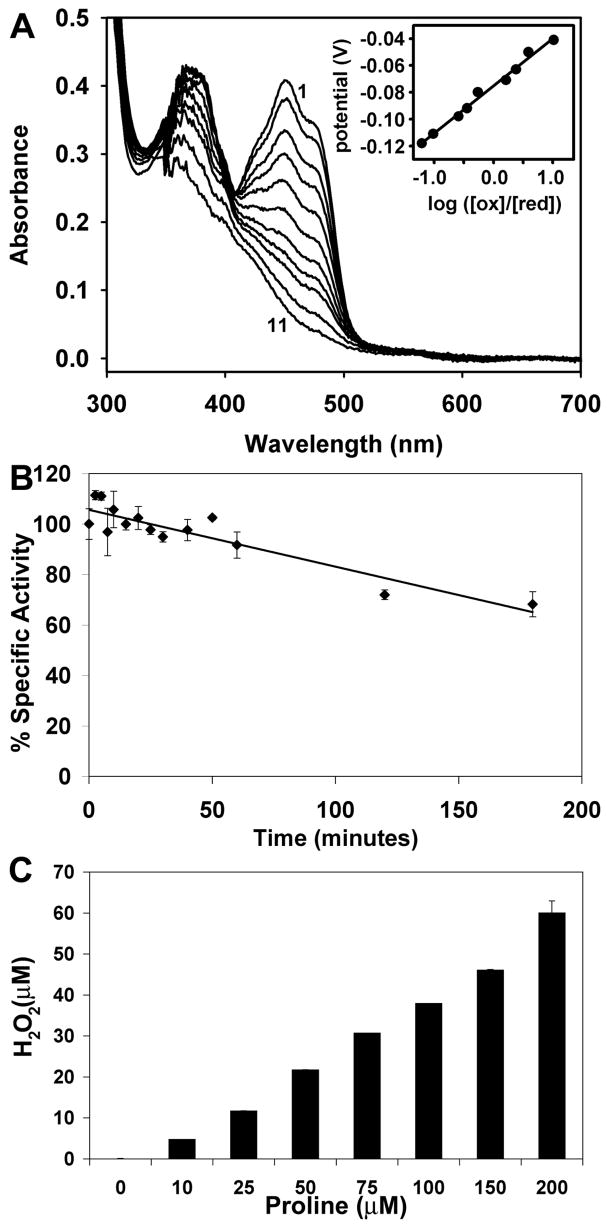
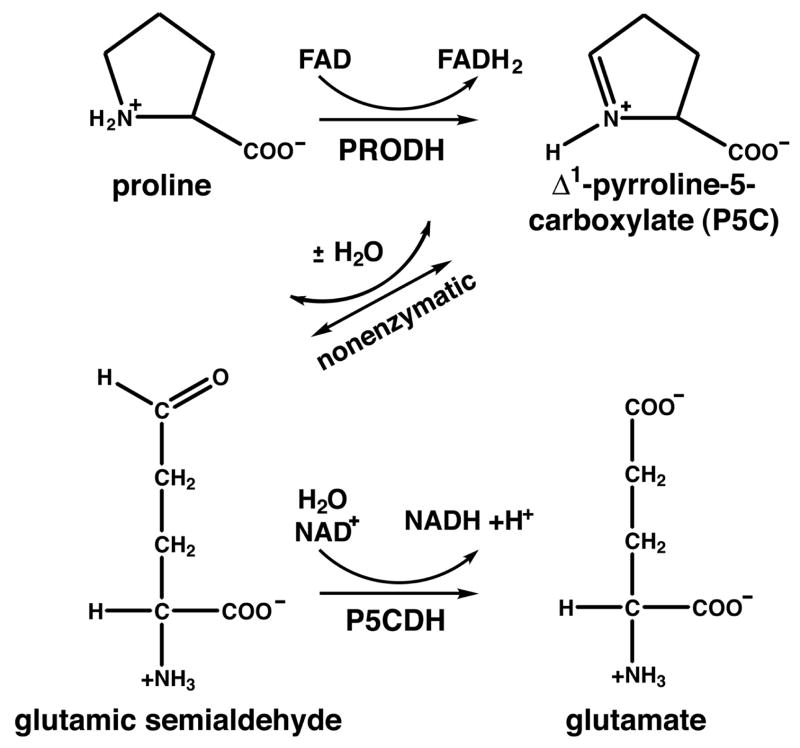
Proline dehydrogenase (PRODH) and Delta(1)-pyrroline-5-carboxylate dehydrogenase (P5CDH) catalyze the two-step oxidation of proline to glutamate. They are distinct monofunctional enzymes in all eukaryotes and some bacteria but are fused into bifunctional enzymes known as proline utilization A (PutA) in other bacteria. Here we report the first structure and biochemical data for a monofunctional PRODH. The 2.0-A resolution structure of Thermus thermophilus PRODH reveals a distorted (betaalpha)(8) barrel catalytic core domain and a hydrophobic alpha-helical domain located above the carboxyl-terminal ends of the strands of the barrel. Although the catalytic core is similar to that of the PutA PRODH domain, the FAD conformation of T. thermophilus PRODH is remarkably different and likely reflects unique requirements for membrane association and communication with P5CDH. Also, the FAD of T. thermophilus PRODH is highly solvent-exposed compared with PutA due to a 4-A shift of helix 8. Structure-based sequence analysis of the PutA/PRODH family led us to identify nine conserved motifs involved in cofactor and substrate recognition. Biochemical studies show that the midpoint potential of the FAD is -75 mV and the kinetic parameters for proline are K(m) = 27 mm and k(cat) = 13 s(-1). 3,4-Dehydro-l-proline was found to be an efficient substrate, and l-tetrahydro-2-furoic acid is a competitive inhibitor (K(I) = 1.0 mm). Finally, we demonstrate that T. thermophilus PRODH reacts with O(2) producing superoxide. This is significant because superoxide production underlies the role of human PRODH in p53-mediated apoptosis, implying commonalities between eukaryotic and bacterial monofunctional PRODHs.


Figures

Figure 1
Figure 1. Overall structure of TtPRODH
A, ribbon drawing of the two TtPRODH molecules in the asymmetric unit. The protein chains are colored in the rainbow scheme, with dark blue at the N-terminus and red at the C-terminus. Selected α-helices and β-strands are labeled. The FADs are drawn as stick models in yellow. The glycine hinge between β8 and α8 is noted (Gly279). B, the solvent exposed hydrophobic patch formed by α-helices A, B, C and 8. The orientation is similar to that of the right hand protein in panel A. Side chains of the patch are colored green. C, surface representation of the hydrophobic patch. The orientation is identical to that of panel B. This figure and others were created with PyMOL (59).
Figure 2
Figure 2. Comparison of TtPRODH and PutA86-669 complexed with THFA
A, superposition of TtPRODH (blue) and PutA86-669/THFA (white, PDB code 1TIW). The FAD cofactors of TtPRODH and PutA86-669 are colored yellow and green, respectively. Glu65 of TtPRODH is drawn in stick mode. Trp438 of PutA86-669, which stacks against the FAD adenine, is also drawn. The dashed lines indicate the Glu289-Arg555 ion pair in PutA86-669. B, space-filling representation of TtPRODH emphasizing solvent exposure of the FAD (yellow). Helix α8 is colored magenta. Tyr190 is shown in green. The orientation is similar to that of panel A.
Figure 3
Figure 3. Stereographic drawing of protein-FAD interactions in TtPRODH
The dotted lines indicate hydrogen bonds and ion pairs. The FAD is colored yellow. Residues interacting with FAD are colored green. Strands β4 and β6 are indicated.
Figure 4
Figure 4. Comparison of the FAD conformations of TtPRODH and PutA86-669
A, two views of the FAD from TtPRODH covered by an experimental electron density map (1σ). The map was calculated using |Fobs| and experimental phases after density modification. B, stereographic view of the FAD cofactors from TtPRODH (yellow C atoms, orange P atoms), PutA86-669/THFA (green C atoms, cyan P atoms) and dithionite-reduced PutA86-669 (white C atoms, cyan P atoms). The 2′-OH and 4′-OH groups of TtPRODH are indicated. Note that the 2′-OH groups of TtPRODH and dithionite-reduced PutA86-669 superimpose nearly perfectly, whereas the 2′-OH group of PutA86-669/THFA points toward the viewer. The orange dotted lines denote hydrogen bonds in the TtPRODH cofactor. The black dotted lines denote hydrogen bonds in the PutA86-669 cofactors. The 3′–OH hydrogen bond to the ribose is present in both PutA86-669 structures but only one dotted line is drawn for clarity.
Figure 5
Figure 5. Comparison of the active sites of TtPRODH (yellow) and PutA86-669/THFA (white)
A, stereographic drawing emphasizing differences between the two enzymes in interactions with the pyrophosphate and adenosine moieties. Residues are labelled as TtPRODH/PutA86-669. The orange and black dotted lines denote hydrogen bonds in TtPRODH and PutA86-669, respectively. B, stereographic drawing showing differences between the two enzymes in the proline-binding pocket. The inhibitor THFA is shown in green. Residues are labelled as TtPRODH/PutA86-669. The orange and black dotted lines denote hydrogen bonds in TtPRODH and PutA86-669, respectively. For clarity, Y275/Y540, which form hydrogen bonds with D133/D370, are not labeled.
Figure 6
Figure 6. Biochemical studies of TtPRODH
A, potentiometric titration of TtPRODH (25 μM) at 20 °C (pH 7.5). Curves 1–11 correspond to fully oxidized, −0.041 V, −0.050 V, −0.063 V, −0.071 V, −0.08 V, −0.092 V, −0.098 V, −0.111 V, −0.118 V, and fully reduced, respectively. The inset is a Nernst plot of the potentiometric data, which yielded a midpoint potential of Em = −0.075 V with slope of 35 mV. B, thermostability analysis of TtPRODH. The percent activity remaining after incubation of the enzyme at 90 °C is plotted as a function of incubation time. C, generation of hydrogen peroxide by TtPRODH. Production of H2O2 was measured using the Amplex Red H2O2/peroxidase assay kit as described in the text.
Scheme 1
Scheme 1

References

    1. Adams E, Frank L. Annu Rev Biochem. 1980;49:1005–1061. - PubMed
    1. Phang JM. Curr Top Cell Reg. 1985;25:92–132. - PubMed
    1. Zhang M, White TA, Schuermann JP, Baban BA, Becker DF, Tanner JJ. Biochemistry. 2004;43(39):12539–12548. - PMC - PubMed
    1. Lee YH, Nadaraia S, Gu D, Becker DF, Tanner JJ. Nat Struct Biol. 2003;10(2):109–114. - PMC - PubMed
    1. Inagaki E, Ohshima N, Takahashi H, Kuroishi C, Yokoyama S, Tahirov TH. J Mol Biol. 2006;362(3):490–501. - PubMed

Publication types

Associated data

LinkOut - more resources