. 2007 May;81(10):5000-13.
doi: 10.1128/JVI.02237-06. Epub 2007 Mar 7.

APOBEC3G multimers are recruited to the plasma membrane for packaging into human immunodeficiency virus type 1 virus-like particles in an RNA-dependent process requiring the NC basic linker

Affiliations

APOBEC3G multimers are recruited to the plasma membrane for packaging into human immunodeficiency virus type 1 virus-like particles in an RNA-dependent process requiring the NC basic linker

Atuhani Burnett et al. J Virol. 2007 May.

Abstract

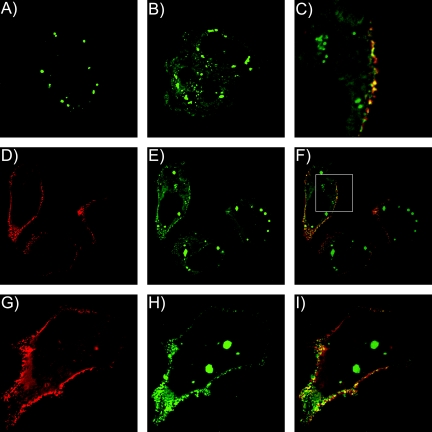
APOBEC3G is an endogenous host restriction factor that inhibits human immunodeficiency virus (HIV) replication. The antiviral activity of APOBEC3G is dependent upon its incorporation into the virus particle. The mechanisms governing incorporation of APOBEC3G into virus particles are not completely understood. In particular, some investigators have reported that APOBEC3G interacts directly with the nucleocapsid (NC) subunit of Gag, while others have found that an RNA intermediate is required for Gag-APOBEC3G interactions. In this study, we confirmed the RNA dependence of APOBEC3G packaging and performed detailed mapping of the determinants within NC that are required for virion incorporation. Surprisingly, APOBEC3G packaging did not correlate well with the presence of the N-terminal "I," or interaction, domain within NC. Specifically, Gag constructs containing only the N-terminal region of NC packaged minimal amounts of APOBEC3G, while significant levels of APOBEC3G packaging were achieved with Gag constructs containing the basic linker region of NC. Furthermore, membrane-binding experiments revealed that the basic linker region was essential for the membrane association of APOBEC3G in a Gag-APOBEC3G complex. Fluorescence resonance energy transfer was detected between labeled APOBEC3G in cells and in particles, indicating that APOBEC3G is packaged as a multimer that is bound to packaged RNA. Regions of APOBEC3G-Gag colocalization at the plasma membrane were detected that were distinct from the punctate cytoplasmic bodies where APOBEC3G accumulates within the cell. Together, our results indicate that APOBEC3G multimerizes in an RNA-dependent fashion and that RNA-APOBEC3G multimers are recruited to the plasma membrane and subsequently into virion particles by Gag.


Figures

FIG. 1.
FIG. 1.
APOBEC3G incorporation into Gag VLPs. (A) APOBEC3G bearing an HA tag was expressed in 293T cells in the presence or absence of Gag. Shown are immunoblots probed with anti-HA antibody (top) and pooled HIV patients’ sera (bottom). (B) A3G-YFP or YFP alone was coexpressed with Gag-CFP, and the amounts of YFP incorporated into Gag-CFP particles and corresponding cell lysates were quantified using a scanning cuvette fluorometer. Results are shown as a percentage of total relative fluorescence units (%RFU) released (supernatant/supernatant + cell).
FIG. 2.
FIG. 2.
Nucleocapsid determinants of APOBEC3G incorporation. (A) Schematic illustration of Pr55Gag and position of the N-terminal I domain and selected amino acids. (B) Schematic representation of Gag-CFP constructs subdividing HIV-1 NC. Asterisks indicate the sites of Gag truncation and CFP fusion. The number represents the C-terminal amino acid residue expressed, with the Gag initiator methionine considered residue 1. Arrows represent HIV protease cleavage sites. (C) Gag-CFP fusion constructs illustrated above were cotransfected with A3G-YFP. Supernatants were concentrated through a 20% sucrose cushion. A3G-YFP released in microvesicle contamination is estimated by the YFP fluorescence released when A3G-YFP is cotransfected with pcDNA control and represented less than 5% of the signal seen upon expression of full-length Gag. This value was subtracted, and the resulting numbers of Gag-induced relative fluorescence units (RFU) of A3G-YFP released, normalized to the amount of Gag protein present, are shown. (D) Gag-CFP fusion constructs illustrated above were cotransfected with APOBEC3G. Supernatants were concentrated through a 20% sucrose cushion. CFP fluorescence was used to normalize virus-like particle concentration. Proteins were resolved by SDS-polyacrylamide gel electrophoresis, followed by immunoblot analysis with APOBEC3G antisera and pooled HIV patient sera for Gag-CFP.
FIG. 3.
FIG. 3.
RNA content of particles correlates closely with APOBEC3G content. Gag-CFP fusion constructs were transfected into 293T cells. Supernatants were purified on linear 20 to 60% sucrose gradients. Fractions were collected from the top of the gradient, treated with RQ1 DNase, stained with RiboGreen, and subjected to analysis by fluorometry. (A) RNA content of particles in peak fractions is shown normalized to Gag-CFP content (RNA:Gag ratio). RFU, relative fluorescence units. (B) Sedimentation pattern of Gag-CFP VLPs (black squares) and associated RNA (gray circles).
FIG. 4.
FIG. 4.
Nucleocapsid determinants of APOBEC3G membrane recruitment. Gag-CFP fusion constructs illustrated in Fig. 2B were cotransfected with A3G-YFP. The protein content of membrane-enriched fractions generated by flotation on iodixanol step gradients was determined by fluorescence spectrophotometry. The percentage of protein present in the membrane fraction was calculated by dividing by the amount of protein present in the total cell lysate. (A) YFP signal was used to determine the amount of APOBEC3G present in membrane fractions for each indicated construct. RFU, relative fluorescence units. (B) CFP signal was used to determine the amount of Gag protein present in membrane fractions for each indicated construct.
FIG. 5.
FIG. 5.
RNase disrupts APOBEC3G binding to NC. (A) Cell lysates from 293T cells expressing APOBEC3G-HA were added to glutathione agarose beads containing the indicated bacterially purified Gag subunits. After extensive washing, the glutathione beads were analyzed by SDS-PAGE, followed by both Coomassie blue staining and immunoblot analysis with anti-HA for APOBEC3G-HA. In, 5% of input. (B) As described above, following the addition of RNase and DNase to the cell lysates prior to performing GST pulldown.
FIG. 6.
FIG. 6.
APOBEC3G is packaged as multimers that interact with RNA. (A) The indicated constructs were cotransfected into 293T cells. Cells were resuspended in PBS and read directly with a scanning cuvette fluorometer. FRET was measured by stimulating the CFP fluorophore at 433 nm, and the FRET peak was observed at 527 nm. Gray squares, FRET curve for A3G-YFP/A3G-CFP and GagCFP/GagYFP (open squares). Open circles, pEYFP coexpressed with A3G-CFP. Closed triangles, GagCFP VLPs. (B) Relative levels of cellular YFP expression are shown for the experiment depicted in panel A, as determined by peak YFP output following excitation of cell lysates at 514 nm. (C) Cell lysates prepared by treatment with hypotonic buffer and Dounce homogenization. Half of the cell lysates were treated with RNase A and DNase RQ1 prior to FRET analysis, while RNA in the control lysates were preserved with RNase inhibitor. Gray squares, FRET curve for A3G-YFP/A3G-CFP; open circles, loss of FRET in nuclease-treated A3G-YFP/A3G-CFP lysates. Closed triangles, A3G-CFP curve and treated (closed diamonds). (D) Relative levels of cellular YFP expression are shown for the experiment depicted in panel A, as determined by peak YFP output following excitation of cell lysates at 514 nm. (E) VLPs created by coexpressing pVRC3900Gag with the indicated constructs in 293T cells. Supernatants were concentrated through a 20% sucrose cushion, resuspended in PBS, and analyzed by scanning cuvette fluorometry. Open circles, FRET curve for A3G-CFP/A3G-YFP and for A3G-CFP/YFP-A3G (gray boxes). Closed triangles, A3G-CFP coexpressed with pEYFP. (F) Relative levels of VLP YFP content are shown for the experiment depicted in panel C, as determined by peak YFP output following excitation of VLPs at 514 nm. Note that transfection of an untagged Gag expression construct was included in each of the transfections at a constant amount.
FIG. 7.
FIG. 7.
Lack of FRET between APOBEC3G and Gag. (A) The indicated constructs were cotransfected into 293T cells. Cells were resuspended in PBS and read directly with a scanning cuvette fluorometer. FRET was measured by stimulating the CFP fluorophore at 433 nm, and the FRET peak was observed at 527 nm. Gray circles, FRET curve for Gag-YFP/Gag-CFP. Open squares, Gag-YFP coexpressed with A3G-CFP and pECFP (closed triangles). (B) Relative levels of cellular YFP expression are shown for the experiment whose results are depicted in panel A, as determined by peak YFP output following excitation of cell lysates at 514 nm. (C) VLPs created by coexpressing the indicated constructs in 293T cells. Supernatants were concentrated through a 20% sucrose cushion, resuspended in PBS, and analyzed by scanning cuvette fluorometry. Gray circles, FRET curve for Gag-CFP/Gag-YFP. Open squares, Gag-CFP coexpressed with A3G-YFP and pEYFP (closed triangles). (D) Relative levels of VLP YFP content are shown for the experiment whose results are depicted in panel C, as determined by peak YFP output following excitation of VLPs at 514 nm.
FIG. 8.
FIG. 8.
Subcellular localization of Gag and A3G-YFP. A3G-YFP and Gag-CFP were expressed in HeLa cells and visualized by optical sectioning with a Nikon TE2000 microscope equipped with an automated stage and z-axis motor, followed by deconvolution using constrained-iterative algorithms. (A) Bright cytoplasmic collections of A3G-YFP are consistent with P body localization. (B) A longer exposure time allowing saturation of P body signal reveals a diffuse cytoplasmic A3G-YFP signal. (C) Magnified section (panel 8F, inset) showing plasma membrane colocalization of Gag (red) and A3G-YFP (green) signals. (D to F) Single-channel images and image overlay indicating Gag signal (red), and A3G-YFP signal (green). (G to I) Similar technique as in panels D to F, but bright collections of A3G-YFP in the cell interiorwere bleached with a 488-nm laser to diminish brightness and facilitate visualization of plasma membrane fluorescence.
FIG. 9.
FIG. 9.
Analysis of A3G-A3G interactions by confocal microscopy and fluorescence acceptor photobleaching. (A) Gag-CFP and Gag-YFP were cotransfected in HeLa cells, and images were obtained with a Zeiss LSM 510-Meta confocal microscope. The image represents YFP excitation-emission before photobleaching. The arrows indicate the selected plasma membrane region of interest to be bleached (ROI1) and the control region (ROI2). (B) The same cell as that shown in panel A is depicted following photobleaching at 514 nm in the indicated square. (C) Emission scans were obtained from region of interest 1, with excitation at 405 nm (CFP excitation), before (dashed line) and after (solid line) photobleaching of cells shown in panels A and B. (D) Emission scans were obtained from the control region of interest 2, with excitation at 405 nm, before (dashed line) and after (solid line) photobleaching of cells shown in panels A and B. (E) A3G-CFP and A3G-YFP were cotransfected in HeLa cells, and the image shows the distribution of A3G-YFP prior to bleaching. The regions of interest selected are consistent with P body localization. (F) The same cell as that shown in panel E is shown after photobleaching of the indicated square. (G) Spectra obtained from ROI1 before (dashed line) and after (solid line) photobleaching from cells shown in panels E and F. (H) Spectra obtained from ROI2 before (dashed line) and after (solid line) photobleaching from cells shown in panels E and F. Scale bar represents 10 micrometers.
FIG. 10.
FIG. 10.
Subcellular localization of A3G-CFP and A3G-YFP FRET. (A to C) CFP, YFP, and FRET images obtained from HeLa cells expressing Gag-CFP (negative control). (D to F) CFP, YFP, and FRET images from cells expressing Gag-YFP (negative control). (G to I) CFP, YFP, and FRET images from cells expressing both Gag-CFP and Gag-YFP. (J to L) CFP, YFP, and FRET images from cells expressing A3G-CFP and A3G-YFP (without Gag). Structures consistent with the subcellular localization of P bodies exhibit FRET. (M to O) CFP, YFP, and FRET images from a cell expressing Gag, A3G-CFP, and A3G-YFP. In addition to P body FRET, plasma membrane FRET and a low level of cytoplasmic FRET are shown. Scale bar represents 10 micrometers.

References

    1. Alce, T. M., and W. Popik. 2004. APOBEC3G is incorporated into virus-like particles by a direct interaction with HIV-1 Gag nucleocapsid protein. J. Biol. Chem. 279:34083-34086. - PubMed
    1. Bennett, R. P., T. D. Nelle, and J. W. Wills. 1993. Functional chimeras of the Rous sarcoma virus and human immunodeficiency virus Gag proteins. J. Virol. 67:6487-6498. - PMC - PubMed
    1. Bowzard, J. B., R. P. Bennett, N. K. Krishna, S. M. Ernst, A. Rein, and J. W. Wills. 1998. Importance of basic residues in the nucleocapsid sequence for retrovirus Gag assembly and complementation rescue. J. Virol. 72:9034-9044. - PMC - PubMed
    1. Cen, S., F. Guo, M. Niu, J. Saadatmand, J. Deflassieux, and L. Kleiman. 2004. The interaction between HIV-1 Gag and APOBEC3G. J. Biol. Chem. 279:33177-33184. - PubMed
    1. Chiu, Y. L., V. B. Soros, J. F. Kreisberg, K. Stopak, W. Yonemoto, and W. C. Greene. 2005. Cellular APOBEC3G restricts HIV-1 infection in resting CD4+ T cells. Nature 435:108-114. - PubMed

Publication types

LinkOut - more resources