. 2007;35(6):2093-104.
doi: 10.1093/nar/gkm099. Epub 2007 Mar 7.

Cancer-derived p53 mutants suppress p53-target gene expression--potential mechanism for gain of function of mutant p53

Affiliations

Cancer-derived p53 mutants suppress p53-target gene expression--potential mechanism for gain of function of mutant p53

Faina Vikhanskaya et al. Nucleic Acids Res. 2007.

Abstract

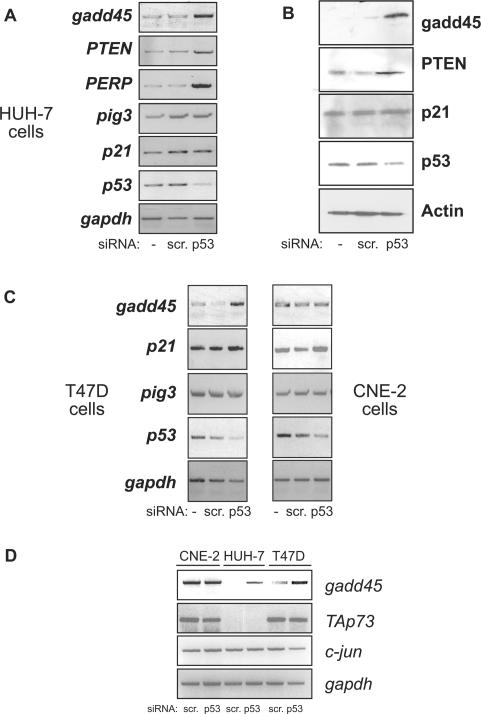
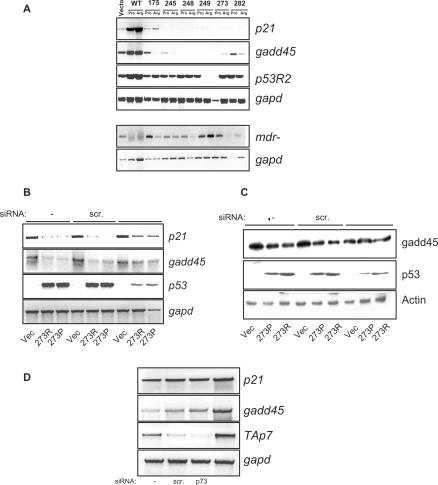
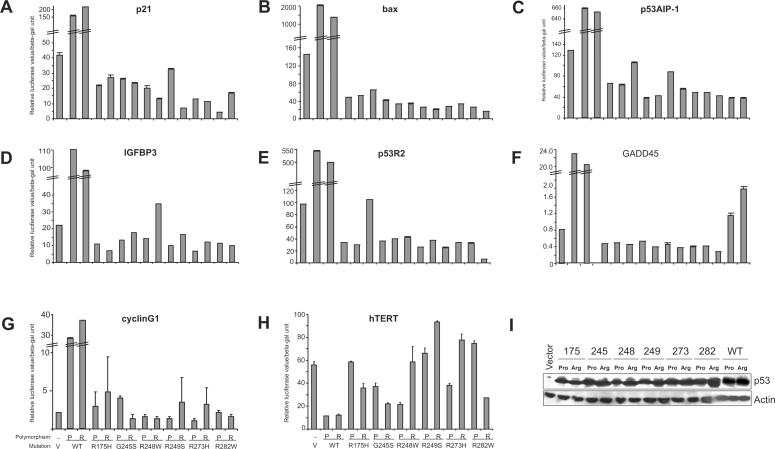
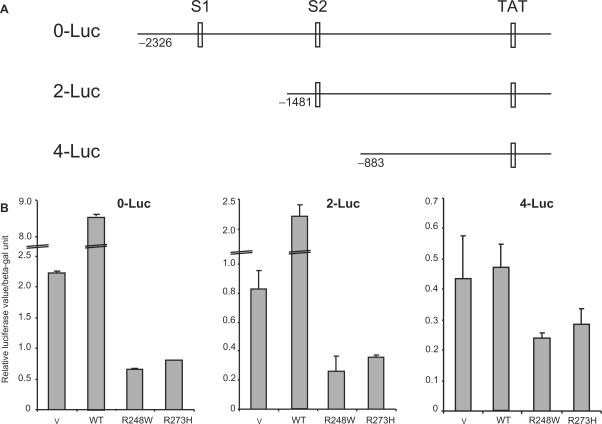
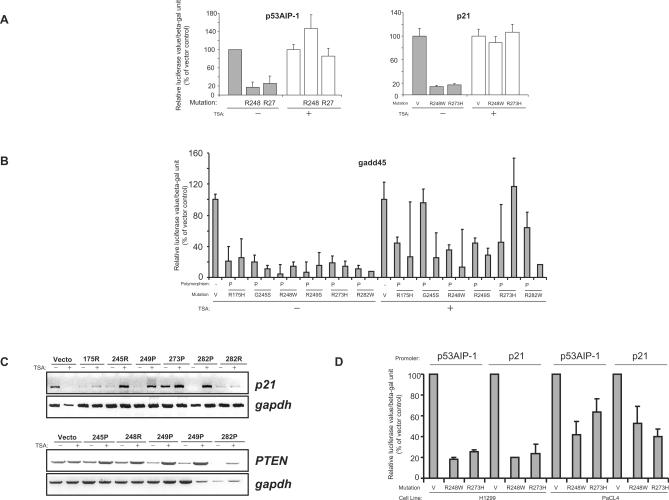
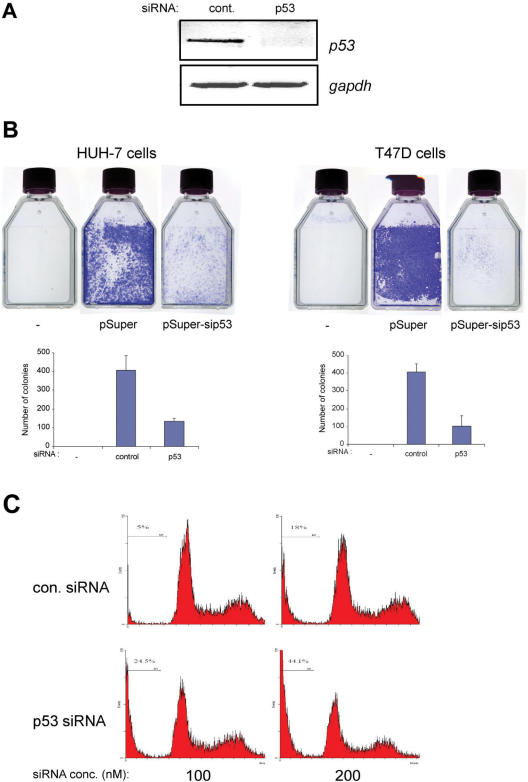
Tumour-derived p53 mutants are thought to have acquired 'gain-of-function' properties that contribute to oncogenicity. We have tested the hypothesis that p53 mutants suppress p53-target gene expression, leading to enhanced cellular growth. Silencing of mutant p53 expression in several human cell lines was found to lead to the upregulation of wild-type p53-target genes such as p21, gadd45, PERP and PTEN. The expression of these genes was also suppressed in H1299-based isogenic cell lines expressing various hot-spot p53 mutants, and silencing of mutant p53, but not TAp73, abrogated the suppression. Consistently, these hot-spot p53 mutants were able to suppress a variety of p53-target gene promoters. Analysis using the proto-type p21 promoter construct indicated that the p53-binding sites are dispensable for mutant p53-mediated suppression. However, treatment with the histone deacetylase inhibitor trichostatin-A resulted in relief of mutant p53-mediated suppression, suggesting that mutant p53 may induce hypo-acetylation of target gene promoters leading to the suppressive effects. Finally, we show that stable down-regulation of mutant p53 expression resulted in reduced cellular colony growth in human cancer cells, which was found to be due to the induction of apoptosis. Together, the results demonstrate another mechanism through which p53 mutants could promote cellular growth.


Figures

Figure 1.
Figure 1.
Silencing of mutant p53 expression results in upregulation of p53-target gene expression. (A and B) Mutant p53 harbouring HUH-7 hepatoma cells (A220G) were untransfected (−) or transfected with either control scrambled siRNA or p53-specific siRNA. Cells were collected 48 h later for mRNA analysis of the indicated target genes by reverse-transcriptase (RT) PCR reaction (A) or by immunoblotting with the specific antibodies (B). (C) RT-PCR target gene analysis was similarly performed in T47D breast cancer cells (C194T) (left panel) and CNE-2 nasopharyngeal carcinoma cells (R280T) (right panel). (D) mRNA analysis shows direct comparison of p53-regulated gadd45 gene expression as well as p53-independent TAp73 and c-Jun expression levels in all three cell lines.
Figure 2.
Figure 2.
Mutant p53 expression leads to suppression of p53-target gene expression, which is relieved upon silencing of mutant p53 expression. (A) H1299-based isogeneic cell lines stably expressing the six hot-spot p53 mutants (i.e. 175, 245, 248, 249, 273 and 282) either in the proline (Pro) or arginine (Arg) codon 72 polymorphic form were analysed for steady-state p53-target gene expression levels, as indicated, by reverse-transcriptase PCR reaction. H1299-cells stably expressing the temperature-sensitive p53 mutants, which adopt a wild-type conformation at 32°C, were grown at 32°C and used as positive controls for p53-target gene activation (WT-Pro and Arg). Levels of mdr-1 were also evaluated. (B and C) H1299-cells expressing p53 mutant R273H in the proline (P) or arginine (R) codon 72 polymorphic form were transfected with either control scrambled siRNA or p53-specific siRNA or left untransfected (−). Cells were collected 48 h later for mRNA analysis of the indicated target genes by RT-PCR reaction (B) or by immunoblot analysis (C). (D) Vector-expressing H1299 cells were transfected with control scrambled siRNA, p73-specific siRNA, p73DD cDNA or left untransfected (−), and the levels of target genes were analysed by RT-PCR reaction.
Figure 3.
Figure 3.
Mutant p53 expression results in down-regulation of p53-target gene promoters. (A–H) H1299 cells were transiently transfected with plasmids expressing the empty vector (pCDNA) (V), wild-type (WT) or the p53 mutant constructs either in a Proline (P) or Arginine (R) form, together with the various reporter plasmids expressing the firefly luciferase gene under the transcriptional control of the indicated gene promoters. Luciferase activity was analysed 24 h post-transfection. Transfections were carried out in triplicates and at least three independent times and the standard deviations are indicated. Wild-type p53 expression led to massive induction of the p53-target gene promoters, and hence, the graphs are depicted to highlight the down-regulation by mutant p53. (I) Representative western blot analysis was performed using half the samples from the transfections to determine the expression status of p53 in all cases. Actin levels show loading control.
Figure 4.
Figure 4.
Presence of p53 binding sites on p21 promoter is not required for down-regulation by mutant p53. (A) Schematic of p21 promoter indicating the position of the p53 binding sites (S1 and S2) as described (21). (B) Luciferase reporter assays were preformed by transfecting vector, wild-type p53, or the indicated p53 mutant cDNA constructs into H1299 cells as described, with the various p21 promoter constructs. Transfections were carried out in triplicates and at least three independent times and the standard deviations are indicated.
Figure 5.
Figure 5.
Treatment with Trichostatin A relieves mutant p53-mediated suppression of p53-target genes, which is reduced in cells lacking p300. (A and B) Luciferase reporter assays were performed as described above using the indicated p53 constructs in the presence (+) or absence (−) of trichostatin-A (TSA). Cells were pre-treated with TSA (100 ng/ml) for 6 h before transfection and TSA was present during transfection and luciferase activity was analysed 18 h after transfection. Promoter activity was determined using the p53AIP-1, p21 (A) and the gadd45 promoter constructs (B) The level of luciferase activity in mutant p53-transfected cells are shown as the percentage activity compared to the vector-transfected cells, which was set at 100%. (C) H1299-based isogenic cells lines stably expressing the indicated mutant p53 in either the proline (P) or arginine (R) codon 72 polymorphic form were treated in the presence (+) or absence (−) of TSA as described for 18 h and the levels of p21 and PTEN mRNA were analysed by reverse-transcriptase PCR reaction. (D) p53-target gene promoter activity was determined using the p53AIP-1 or p21 promoter constructs in p300 deficient (pancreatic cancer cell line PaCL4) or proficient (lung adenocarcinoma H1299) cells.
Figure 6.
Figure 6.
Silencing of p53 expression results in reduced colony formation and elevated cell death. (A and B) p53 expression was silenced as described in HUH-7 and T47D cells using pSuper-based control or p53-specific siRNA, or were left untransfected. Cells were selected for two weeks on G418. Parallel cultures were used for semi-quantitative RT-PCR analysis of p53 expression status (representative results shown for HUH-7 cells) (A) and colonies were visualized by staining with crystal violet solution (B, upper panel). All experiments were performed at least thrice independently and representative results are shown. Colonies were counted both manually and using colony count software. Similar results were obtained using both methods. Data are presented as the mean ± SD error of the mean. (C) Cell death was analysed by measuring the sub-G1 DNA content reflective of apoptotic cells, by flow cytometry. HUH-7 cells were transfected with scrambled or p53 siRNA (100 or 200 nM) and the percentage cell death was determined 5 days after transfection. Representative results are shown.

Comment in

References

    1. Vousden KH, Lu X. Live or let die: the cell's response to p53. Nat. Rev. Cancer. 2002;2:594–604. - PubMed
    1. Vogelstein B, Lane D, Levine AJ. Surfing the p53 network. Nature. 2000;408:307–310. - PubMed
    1. Olivier M, Hussain SP, Caron de Fromentel C, Hainaut P, Harris CC. TP53 mutation spectra and load: a tool for generating hypotheses on the etiology of cancer. IARC Sci. Publ. 2004;157:247–270. - PubMed
    1. Roemer K. Mutant p53: gain-of-function oncoproteins and wild-type p53 inactivators. Biol. Chem. 1999;380:879–887. - PubMed
    1. Vikhanskaya F, Siddique MM, Lee MK, Broggini M, Sabapathy K. Evaluation of the combined effect of p53 codon 72 polymorphism and hotspot mutations in response to anticancer drugs. Clin. Cancer Res. 2005;11:4348–4356. - PubMed

Publication types