

Restriction endonuclease MvaI is a monomer that recognizes its target sequence asymmetrically
- PMID: 17344322
- PMCID: PMC1874612
- DOI: 10.1093/nar/gkm064
Restriction endonuclease MvaI is a monomer that recognizes its target sequence asymmetrically
Abstract
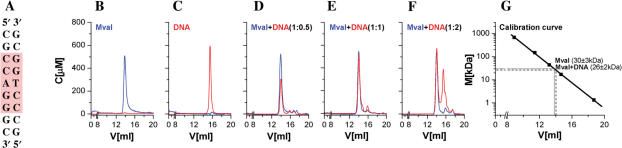
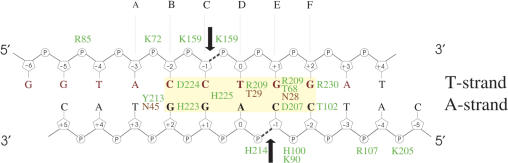
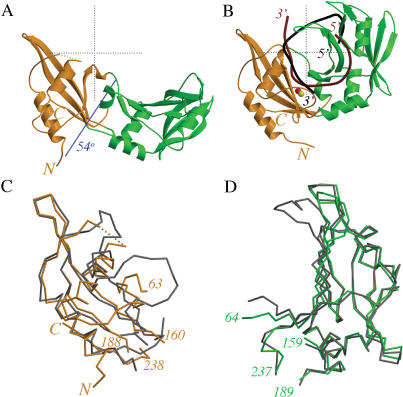
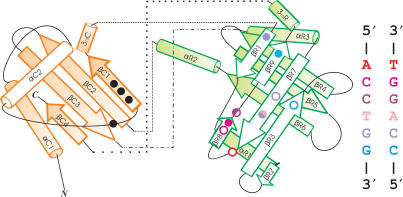
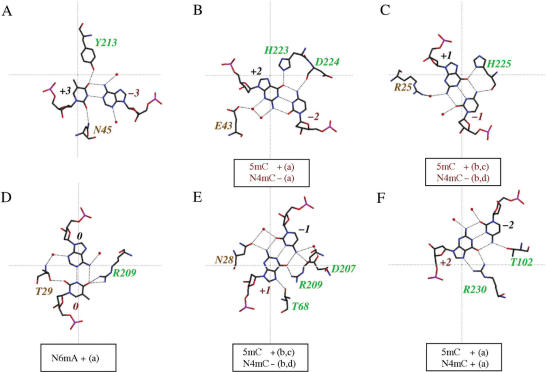
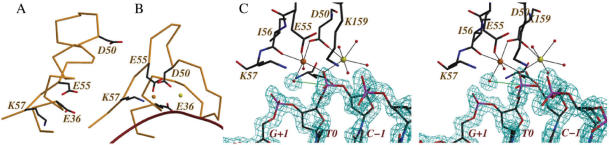
Restriction endonuclease MvaI recognizes the sequence CC/WGG (W stands for A or T, '/' designates the cleavage site) and generates products with single nucleotide 5'-overhangs. The enzyme has been noted for its tolerance towards DNA modifications. Here, we report a biochemical characterization and crystal structures of MvaI in an apo-form and in a complex with target DNA at 1.5 A resolution. Our results show that MvaI is a monomer and recognizes its pseudosymmetric target sequence asymmetrically. The enzyme consists of two lobes. The catalytic lobe anchors the active site residues Glu36, Asp50, Glu55 and Lys57 and contacts the bases from the minor grove side. The recognition lobe mediates all major grove interactions with the bases. The enzyme in the crystal is bound to the strand with T at the center of the recognition sequence. The crystal structure with calcium ions and DNA mimics the prereactive state. MvaI shows structural similarities to BcnI, which cleaves the related sequence CC/SGG and to MutH enzyme, which is a component of the DNA repair machinery, and nicks one DNA strand instead of making a double-strand break.
Figures
Similar articles
-
Monomeric restriction endonuclease BcnI in the apo form and in an asymmetric complex with target DNA.J Mol Biol. 2007 Jun 8;369(3):722-34. doi: 10.1016/j.jmb.2007.03.018. Epub 2007 Mar 15. J Mol Biol. 2007. PMID: 17445830
-
A model of restriction endonuclease MvaI in complex with DNA: a template for interpretation of experimental data and a guide for specificity engineering.Proteins. 2007 Jul 1;68(1):324-36. doi: 10.1002/prot.21460. Proteins. 2007. PMID: 17407166
-
Degenerate sequence recognition by the monomeric restriction enzyme: single mutation converts BcnI into a strand-specific nicking endonuclease.Nucleic Acids Res. 2011 May;39(9):3744-53. doi: 10.1093/nar/gkq1351. Epub 2011 Jan 11. Nucleic Acids Res. 2011. PMID: 21227928 Free PMC article.
-
Restriction endonucleases that resemble a component of the bacterial DNA repair machinery.Cell Mol Life Sci. 2007 Sep;64(18):2351-7. doi: 10.1007/s00018-007-7124-9. Cell Mol Life Sci. 2007. PMID: 17568994 Free PMC article. Review.
-
Restriction endonuclease reactions requiring two recognition sites.Biochem Soc Trans. 1999 Aug;27(4):696-9. doi: 10.1042/bst0270696. Biochem Soc Trans. 1999. PMID: 10917669 Review. No abstract available.
Cited by
-
Re-visiting protein-centric two-tier classification of existing DNA-protein complexes.BMC Bioinformatics. 2012 Jul 16;13:165. doi: 10.1186/1471-2105-13-165. BMC Bioinformatics. 2012. PMID: 22800292 Free PMC article.
-
Nucleotide flipping by restriction enzymes analyzed by 2-aminopurine steady-state fluorescence.Nucleic Acids Res. 2007;35(14):4792-9. doi: 10.1093/nar/gkm513. Epub 2007 Jul 7. Nucleic Acids Res. 2007. PMID: 17617640 Free PMC article.
-
BspRI restriction endonuclease: cloning, expression in Escherichia coli and sequential cleavage mechanism.Nucleic Acids Res. 2010 Nov;38(20):7155-66. doi: 10.1093/nar/gkq567. Epub 2010 Jun 29. Nucleic Acids Res. 2010. PMID: 20587501 Free PMC article.
-
Crystal structure and mechanism of action of the N6-methyladenine-dependent type IIM restriction endonuclease R.DpnI.Nucleic Acids Res. 2012 Aug;40(15):7563-72. doi: 10.1093/nar/gks428. Epub 2012 May 18. Nucleic Acids Res. 2012. PMID: 22610857 Free PMC article.
-
Plasmid pP62BP1 isolated from an Arctic Psychrobacter sp. strain carries two highly homologous type II restriction-modification systems and a putative organic sulfate metabolism operon.Extremophiles. 2012 May;16(3):363-76. doi: 10.1007/s00792-012-0435-2. Epub 2012 Mar 4. Extremophiles. 2012. PMID: 22392282 Free PMC article.
References
Publication types
MeSH terms
Substances
Associated data
- Actions
- Actions
LinkOut - more resources
Full Text Sources
Other Literature Sources
Molecular Biology Databases
