. 2007 Mar 7;27(10):2636-45.
doi: 10.1523/JNEUROSCI.4610-06.2007.

Cellular basis for contrast gain control over the receptive field center of mammalian retinal ganglion cells

Affiliations

Cellular basis for contrast gain control over the receptive field center of mammalian retinal ganglion cells

Deborah L Beaudoin et al. J Neurosci. .

Abstract

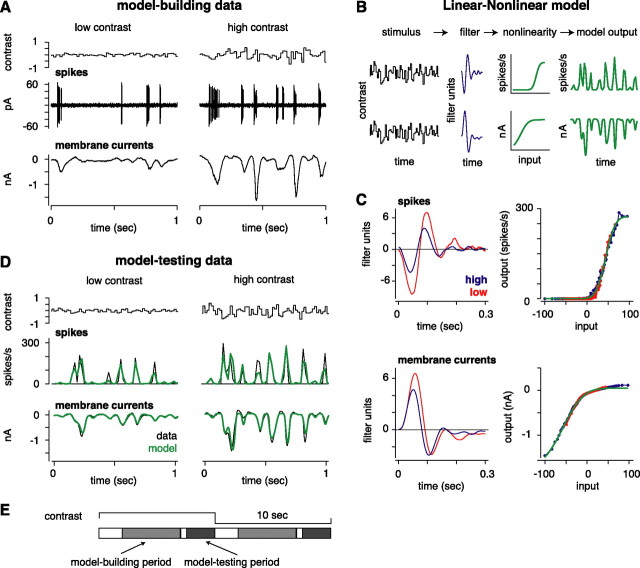
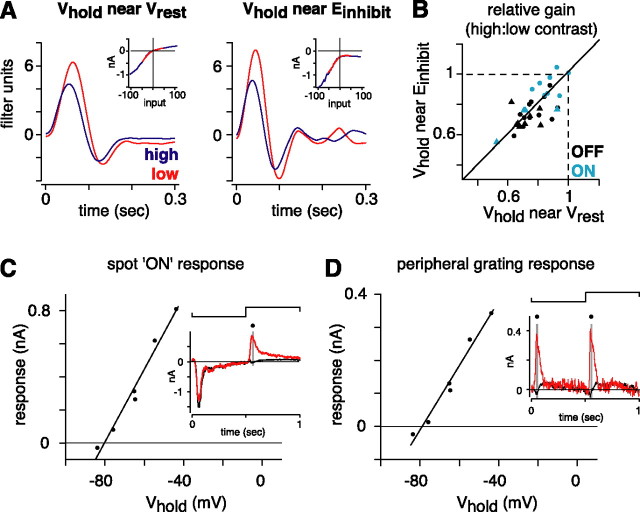
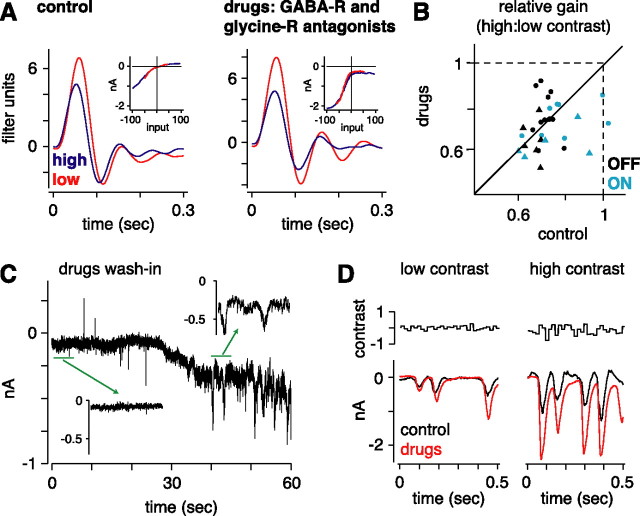
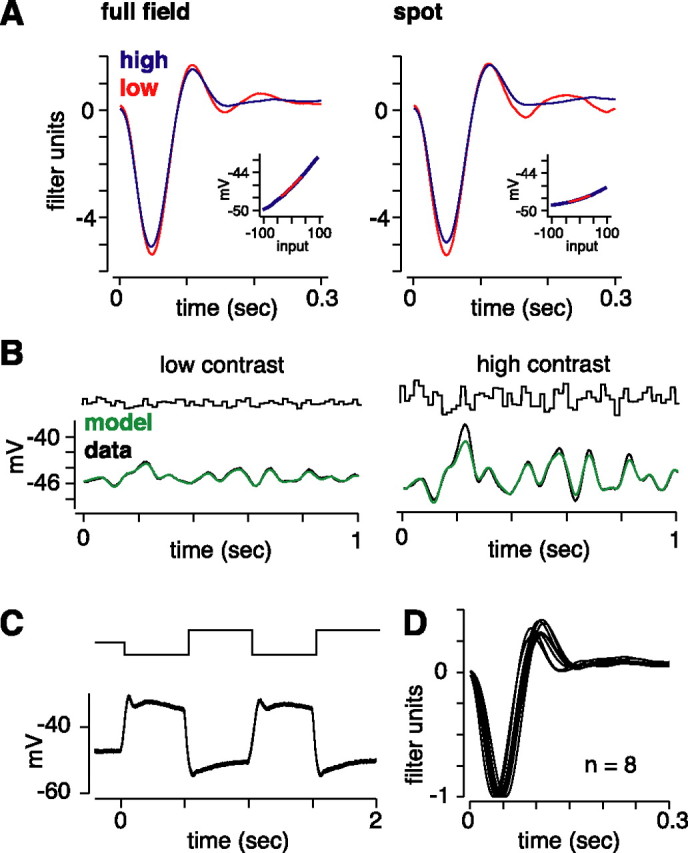
Retinal ganglion cells fire spikes to an appropriate contrast presented over their receptive field center. These center responses undergo dynamic changes in sensitivity depending on the ongoing level of contrast, a process known as "contrast gain control." Extracellular recordings suggested that gain control is driven by a single wide-field mechanism, extending across the center and beyond, that depends on inhibitory interneurons: amacrine cells. However, recordings in salamander suggested that the excitatory bipolar cells, which drive the center, may themselves show gain control independently of amacrine cell mechanisms. Here, we tested in mammalian ganglion cells whether amacrine cells are critical for gain control over the receptive field center. We made extracellular and whole-cell recordings of guinea pig Y-type cells in vitro and quantified the gain change between contrasts using a linear-nonlinear analysis. For spikes, tripling contrast reduced gain by approximately 40%. With spikes blocked, ganglion cells showed similar levels of gain control in membrane currents and voltages and under conditions of low and high calcium buffering: tripling contrast reduced gain by approximately 20-25%. Gain control persisted under voltage-clamp conditions that minimize inhibitory conductances and pharmacological conditions that block inhibitory neurotransmitter receptors. Gain control depended on adequate stimulation, not of ganglion cells but of presynaptic bipolar cells. Furthermore, horizontal cell measurements showed a lack of gain control in photoreceptor synaptic release. Thus, the mechanism for gain control over the ganglion cell receptive field center, as measured in the subthreshold response, originates in the presynaptic bipolar cells and does not require amacrine cell signaling.


Figures

Figure 1.
Figure 1.
Quantifying response gain with random flicker stimulation and the LN analysis. A, Random flicker stimulation and response. The intensity of a spot (0.5 mm diameter; top row) was modulated by drawing values randomly from a Gaussian distribution. The response of the cell was measured by extracellular recording of spikes (middle row) or whole-cell recording of membrane currents (bottom row; Vhold = −73 mV). B, The LN model. The stimulus is convolved with a linear filter (L), and the product is passed through a static nonlinearity (N), resulting in the LN model for both spikes (top row) and membrane currents (bottom row). C, Linear filter and static nonlinearity for the cell in A. The nonlinearities align (see Materials and Methods), and the effect of increasing contrast from low to high is reflected solely in the filters. For both spikes and membrane currents, high contrast reduces the gain (height of the filter) and decreases the integration time (zero-crossing of the filter; see Materials and Methods). The green line in the nonlinearity plot is a fitted cumulative Gaussian used to generate the LN model output in D. D, Testing the LN model. The format is the same as in A. Data are from the repeat segment of the stimulus (see Materials and Methods), averaged over 10 (currents) or 20 trials (spikes; bin size, 20 ms). The LN model predictions (green line), constructed from a separate data set, correspond closely to the data. E, Diagram of the stimulus cycle. The contrast alternated between 10 s of high contrast and 10 s of low contrast. The first 7 s of each half-cycle were unique for each cycle; the model was built from data collected between 2 and 7 s (model-building period). The last 3 s of each half-cycle were repeated across cycles; the model was tested against data collected during the last 2.5 s (model-testing period).
Figure 2.
Figure 2.
Contrast gain control in the spiking response is partially explained by gain control in the synaptic currents. A, Linear filters and static nonlinearities (inset) from extracellular and voltage-clamp recordings of an ON cell (Vhold = −54 mV). The relative gain at high contrast showed more gain control in the spiking response (0.59) relative to the current response (0.80). B, Relative gain at high contrast for spiking and current responses for 53 cells. Gain control was larger for spiking responses relative to current responses. C, Relative integration time for high:low contrast. Integration time was measured by the zero-crossing of the linear filter. High contrast reduced the integration time for OFF cells; the effect was larger for spikes.
Figure 3.
Figure 3.
Contrast gain control does not depend on intrinsic voltage-dependent mechanisms in the ganglion cell. A, Linear filters and static nonlinearities (inset) for an OFF cell recorded under voltage-clamp (Vhold = −72 mV) or current-clamp (K+-based pipette solution with QX-314) conditions. The gain change was similar under voltage clamp (0.76) and current clamp (0.78). B, Relative gain at high contrast for voltage-clamp versus current-clamp conditions. The gain change was similar under the two conditions, suggesting that gain control does not depend on a voltage-dependent mechanism in the ganglion cell.
Figure 4.
Figure 4.
Contrast gain control does not depend on feedforward inhibition at the ganglion cell. A, Linear filters and static nonlinearities (inset) for an OFF cell at a holding potential near Vrest (Vhold = −64 mV) and a hyperpolarized potential nearer to the apparent reversal for inhibition (Vhold = −72 mV). The relative gain at high contrast was similar near Vrest (0.72) and at the hyperpolarized potential (0.67). B, The gain change was similar near Vrest and the hyperpolarized potential, suggesting that gain control does not depend on feedforward inhibition onto the ganglion cell dendrites. The spot intensity was updated at 60 Hz (circles) or 20 Hz (triangles). C, Demonstration of the apparent reversal for inhibition. The response to a contrast-reversing spot was measured at several holding potentials in an OFF cell (same cell as in A). Leak-subtracted responses are shown in the inset for Vhold = −84 mV (black) or −44 mV (red). The current amplitude for the ON response (gray bar) in this OFF cell showed an apparent reversal potential of −80 mV. D, Data are presented in the same format as in C for a contrast-reversing grating in the receptive field periphery (see Materials and Methods). The apparent reversal potential for the outward currents evoked by contrast reversal of the grating was −79 mV.
Figure 5.
Figure 5.
Contrast gain control does not depend on amacrine cell synaptic input. A, Linear filters and static nonlinearities (inset) for an OFF cell without and with bath-applied GABAA/B/C and glycine receptor antagonists (100 μm bicuculline, 100 μm CGP35348, 100 μm TPMPA, and 2 μm strychnine, respectively). The drugs increased the amplitude of responses, as reflected in the nonlinearity, but the gain change (0.61) was not reduced from control conditions (0.73; Vhold = −68 mV). B, Relative gain at high contrast was similar in control conditions and after adding the drugs. Vhold was near Vrest in all cases. The spot intensity was updated at 60 Hz (circles) or 20 Hz (triangles). Plotted are 31 recordings from 27 cells. C, Recording of membrane current during the wash-in of the receptor antagonists. The antagonists caused an inward current accompanied by bursting. Insets show periods of 5 s. D, Responses to low and high contrast before (black) and after (red) adding the receptor antagonists. The antagonists increased the response, but response modulations were similar to control conditions. Spontaneous bursting was less prominent in the presence of dynamic visual stimulation compared with the mean luminance condition in C.
Figure 6.
Figure 6.
Evidence that contrast gain control depends on adequate bipolar cell stimulation rather than ganglion cell stimulation. A, Linear filters and static nonlinearities (inset) for the large spot with high- and low-contrast levels and the small spot with higher contrast levels. Gain control was present for the large and small spots, with higher contrasts, but was absent for the large spot, with lower contrasts. B, Response amplitude (SD of current response) for both contrast levels and the three conditions in A. Shown above the bars are diagrams of the stimuli (0.5 or 0.1 mm diameter) relative to a typical ganglion cell dendritic tree. C, Gain change at high contrast depended on the contrast level, not spot size.
Figure 7.
Figure 7.
Gain control is not apparent at the output of photoreceptor synaptic release. A, Linear filters and static nonlinearity (inset) for a horizontal cell stimulated with either a full-field stimulus (3 × 3 mm) or the typical spot (0.5 mm diameter). The full field yielded a larger response amplitude, as reflected in the nonlinearity, but both stimuli evoked only a negligible gain change (full-field stimulus gain change of 0.95; spot, 0.94). B, LN model fit (green) to high- and low-contrast data (black; same format as in Fig. 1D). C, Response of a horizontal cell to a full-contrast, 2 Hz step stimulus (full field) shows the typical step response. D, All horizontal cells (n = 8) showed a similar shape in their linear filters (shown here normalized to the peak negative response).

Similar articles

Cited by

References

    1. Akopian A, Witkovsky P. Intracellular calcium reduces light-induced excitatory post-synaptic responses in salamander retinal ganglion cells. J Physiol (Lond) 2001;532:43–53. - PMC - PubMed
    1. Baccus SA, Meister M. Fast and slow contrast adaptation in retinal circuitry. Neuron. 2002;36:909–919. - PubMed
    1. Baccus SA, Meister M. Retina versus cortex; contrast adaptation in parallel visual pathways. Neuron. 2004;42:5–7. - PubMed
    1. Benardete EA, Kaplan E. The dynamics of primate M retinal ganglion cells. Vis Neurosci. 1999;16:355–368. - PubMed
    1. Benardete EA, Kaplan E, Knight BW. Contrast gain control in the primate retina: P cells are not X-like, some M cells are. Vis Neurosci. 1992;8:483–486. - PubMed

Publication types

LinkOut - more resources