. 2007 Mar 7;27(10):2683-92.
doi: 10.1523/JNEUROSCI.5077-06.2007.

Transmission of spike trains at the retinogeniculate synapse

Affiliations

Transmission of spike trains at the retinogeniculate synapse

Lawrence C Sincich et al. J Neurosci. .

Abstract

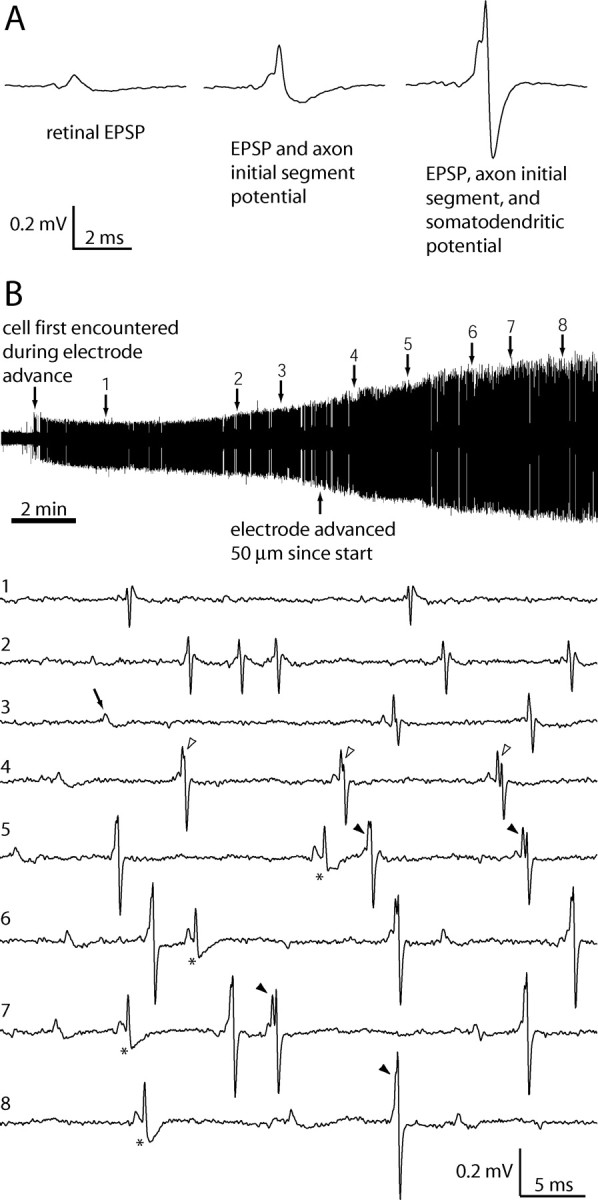
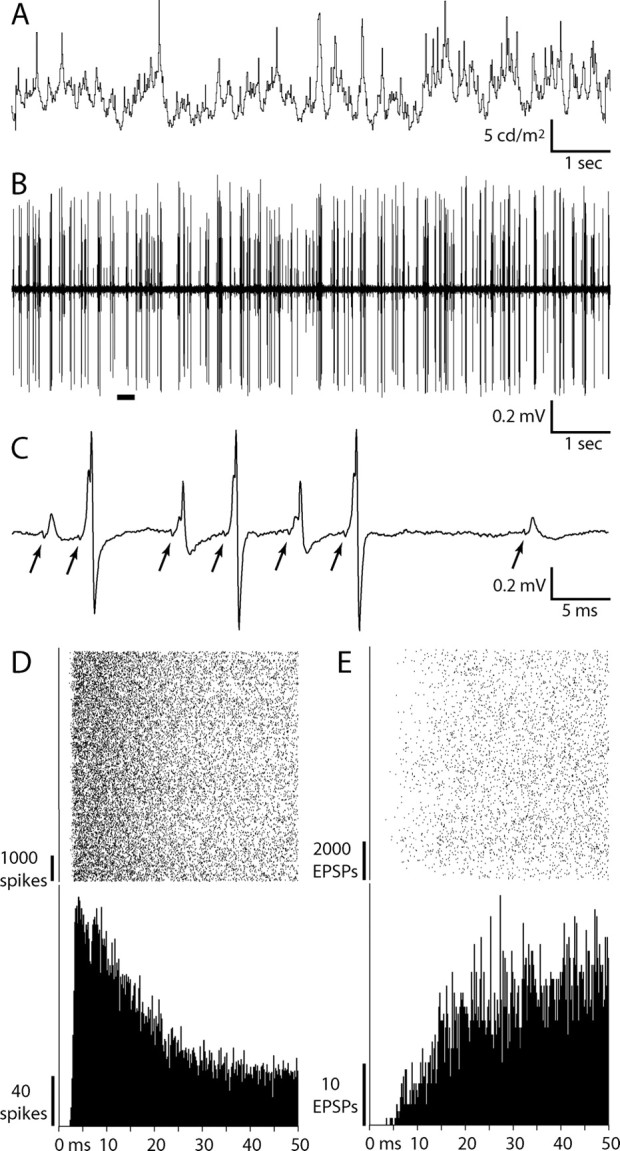
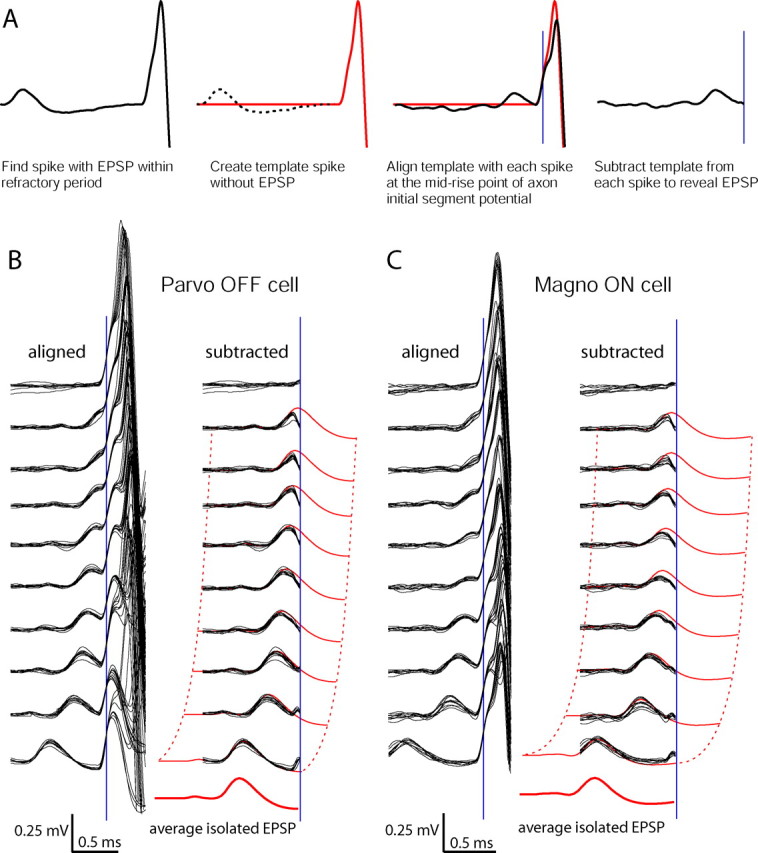
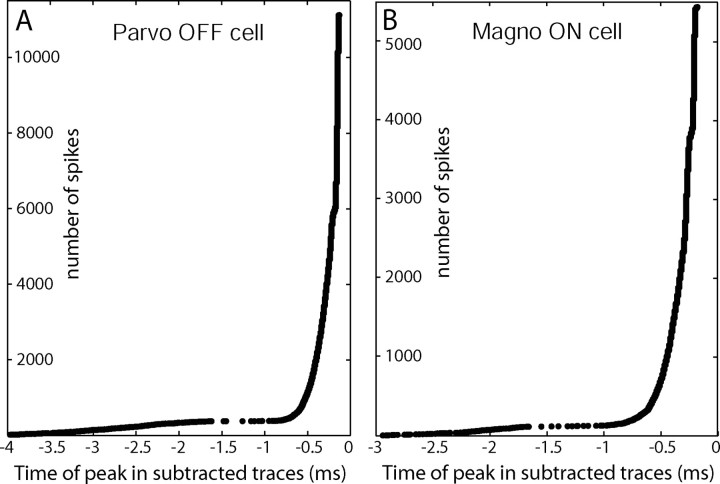
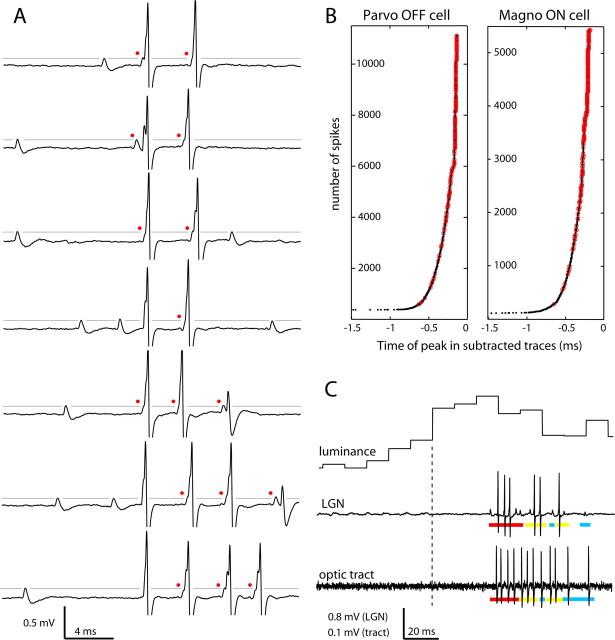
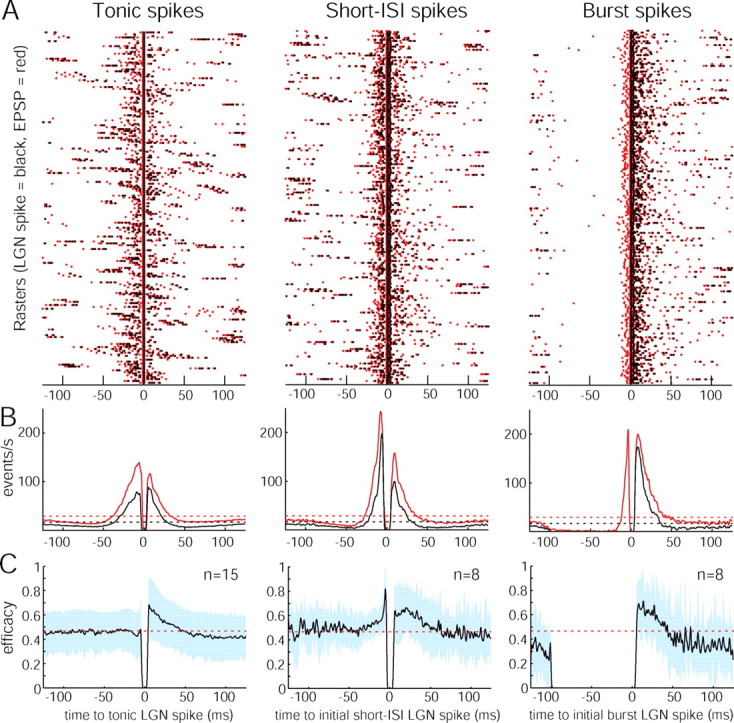
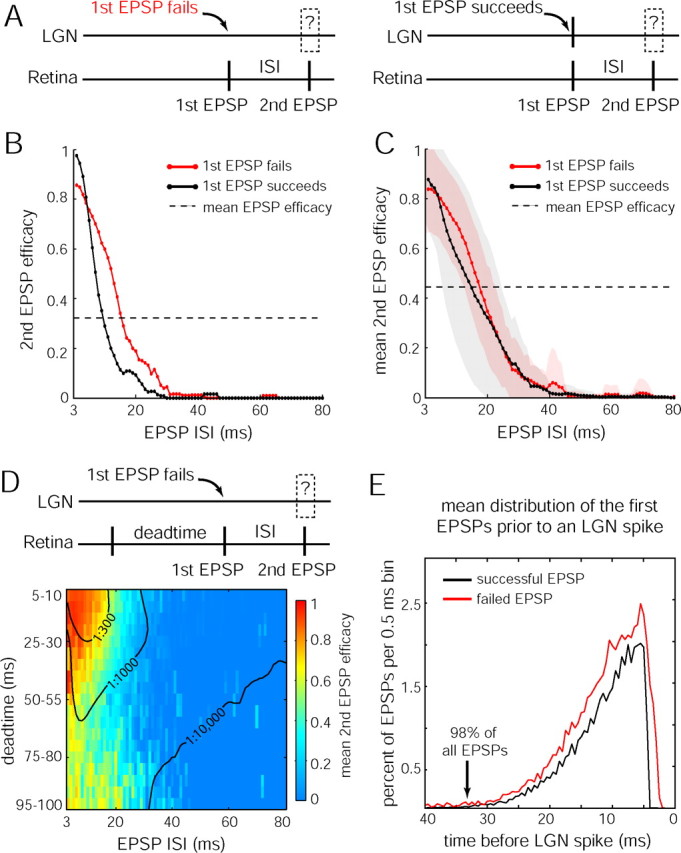
Retinal spikes impinging on relay neurons in the lateral geniculate nucleus (LGN) generate synaptic potentials, which sometimes produce spikes sent to visual cortex. We examined how signal transmission is regulated in the macaque LGN by recording the retinal input to a single LGN neuron while stimulating the receptive field center with a naturalistic luminance sequence. After extracting the EPSPs, which are often partially merged with spike waveforms, we found that >95% of spikes were associated with an EPSP from a single retinal ganglion cell. Each spike within a "burst" train was generated by an EPSP, indicating that LGN bursts are inherited from retinal bursts. LGN neurons rarely fired unless at least two EPSPs summated within 40 ms. This facilitation in EPSP efficacy was followed by depression. If a spike was generated by the first EPSP in a pair, it did not alter the efficacy of the second EPSP. Hence, the timing of EPSPs arising from the primary retinal driver governs synaptic efficacy and provides the basis for successful retinogeniculate transmission.


Figures

Figure 1.
Figure 1.
Variation in LGN spike shapes and appearance of retinal EPSPs as a microelectrode approaches a single LGN neuron. A, Examples of the three typical waveforms: isolated EPSP, EPSP with axon initial segment potential, and EPSP with axon initial segment plus somatodendritic potential. B, During this 15 min record of spontaneous activity, the electrode was advanced 80 μm from the point at which the LGN cell was first detected. The initial waveform (at time point 1) was triphasic, characteristic of an LGN spike recorded at a distance. By time point 3, retinal EPSPs began to appear in isolation (arrow) and immediately preceding LGN spikes. At time point 4, after a 50 μm electrode advance, the two potentials in the LGN waveform became discernable, signified by a notch between the axon initial segment potential and the somatodendritic potential (open arrowheads). The combined waveform varies in shape because of the slight temporal jitter that separates the action potential initiated at the axon initial segment from its propagation back into the somatodendritic compartment (filled arrowheads; time points 5–8). Axon initial segment potentials occasionally failed to invade the soma and dendrites (asterisks). Voltage scale applies to all traces.
Figure 2.
Figure 2.
LGN action potentials and EPSPs recorded during visual stimulation. A, Luminance modulation of a ½° spot of light centered on the receptive field of an ON magnocellular neuron (mean luminance, 6.1 cd/m2). B, Raw electrode trace acquired during this 10 s stimulus epoch. C, Expanded trace of the underlined portion in B, illustrating the occurrence of retinal EPSPs associated with LGN spikes. EPSPs that occur at the beginning of the largest spikes are often difficult to identify because the waveforms are partially merged. The miniscule deflection (“T-potential”) in front of each EPSP (arrows) arises from the retinal action potential invading the axon terminals (Wang et al., 1985), providing independent evidence that an EPSP precedes each LGN spike. D, Spike rasters aligned on each axon initial segment potential (top) and resulting interspike interval histogram (bottom; n = 9044). This LGN neuron had an absolute refractory period of 2.5 ms. E, Rasters and interval histogram for isolated EPSPs, not associated with LGN spikes, compiled over the same time period as in D (n = 11,873). The isolated EPSPs had a refractory period of 3.5 ms.
Figure 3.
Figure 3.
Identification of retinal EPSPs associated with LGN spikes. A, Subtraction of an LGN spike template. First, an LGN spike is selected with a latency long enough to separate it completely from the EPSP waveform but short enough to fall within the absolute refractory period of the EPSP. Second, the template (red trace) is created by zeroing all of the values before the action potential. Next, each LGN spike is aligned at the mid-rise point of the axon initial segment potential (blue line). Finally, the LGN spike waveform is subtracted from the template to yield a residual waveform. B, Aligned and subtracted waveforms for a parvocellular OFF cell, ordered by the latency between the EPSP peak and the LGN spike. Each group of 10 superimposed traces is drawn from equal intervals along the distribution of EPSP–LGN spike latencies to show the range. The subtracted waveforms are superimposed on the average isolated EPSP (in red) to illustrate how the part of each EPSP that has not merged with the action potential resembles the analogous part of the average EPSP. C, Same analysis as in B, for a magnocellular ON cell.
Figure 4.
Figure 4.
Distribution of latencies between subtracted EPSP waveform peaks and LGN spikes. A, For the cell in Figure 3B, the time of the peaks in the subtracted waveforms are plotted, in order of latency, with respect to the peak of the axon initial segment potential. The axon initial segment potential was designated t = 0 because the somatodendritic spike often failed in this cell. The gap in the distribution near −1.5 ms is attributable to the refractory period of the EPSP. B, Distribution of latencies plotted for the cell in Figure 3C. The latencies are shifted in this cell because they are plotted with respect to the peak of the somatodendritic potentials, which have a longer delay after EPSPs than the axon initial segment potentials. Parvo, Parvocellular; Magno, magnocellular.
Figure 5.
Figure 5.
Retinal EPSPs drive nearly all LGN spikes during bursts. A, A representative sample of burst spike trains from the cell in Figure 3B, illustrating the range of EPSP-to-spike latencies. Each of these trains was preceded by 100 ms with no LGN spikes. Red dots mark spikes with identifiable EPSPs within 0.5 ms of the axon initial segment potential. Broken gray line shows that the amplitudes of isolated and merged EPSPs are similar. B, Latencies between subtracted EPSP waveforms and all spikes (black dots, data from Fig. 4) and between subtracted EPSP waveforms and all secondary burst spikes (red circles). C, Retinal ganglion cells and LGN neurons exhibit burst firing activity to the same stimuli. In response to a large step up in luminance (top trace), retinal bursts can be recorded as EPSPs (middle trace, producing a burst in an ON parvocellular LGN neuron) or recorded directly in the optic tract (bottom trace, from an ON midget ganglion cell). Retinal burst events are underscored in red, short-ISI in yellow, and tonic in blue. Although these recordings were made in different animals, the retinal burst trains were similar whether recorded as optic tract spikes or as EPSPs in the LGN. Parvo, Parvocellular; Magno, magnocellular.
Figure 6.
Figure 6.
EPSP efficacy varies in time with LGN spike type. A, A set of 200 rasters for each category of LGN spike from an OFF magnocellular neuron (LGN spike, black dot; EPSP, red dot). Rasters were centered at t = 0 for the LGN tonic spikes and for the initial spikes in a short-ISI or burst spike train. B, LGN spike auto-correlograms (black) and LGN–EPSP cross-correlograms (red) computed from the entire dataset for this cell (tonic, n = 13,267; initial short-ISI, n = 3,560; initial burst, n = 1519). The correlograms were zeroed over the interval −1 < t < 1 ms for tonic spikes and −1 < t < 5 ms for short-ISI and burst spikes to avoid the large central peaks present by definition and were then smoothed with a 2-ms-wide Blackman filter. Bin size, 0.5 ms. Dotted lines, Mean firing rates. C, Population EPSP efficacy profiles for each category of spike, centered on t = 0 for a tonic LGN spike (left) or on the initial spike in a short-ISI or burst train (middle and right). For burst spikes, the efficacy was 0 by definition for 100 ms before the burst train. The number of short-ISI or burst spike trains was too small in seven cells to generate meaningful efficacy curves. Blue shading, One SD; red dotted line, mean efficacy.
Figure 7.
Figure 7.
EPSP efficacy is a function of EPSP intervals but not of LGN spikes. A, Schematic of the LGN and retinal spike train contingencies being compared. B, Second EPSP efficacy as a function of ISI after failed (red) or successful (black) first EPSPs, for the cell analyzed in Figure 6 A–C. Data are boxcar averaged over ±2 ms. C, Mean population data comparing second EPSP efficacies, formatted as in B. Colored shading, One SD. D, Mean second EPSP efficacy of the population, as a function of ISI and dead time since the preceding EPSP, demonstrating cumulative enhancement of multiple EPSPs. Probability of observing pairs that fulfilled interval conditions are indicated by isofrequency contours (black) at 1:300, 1:1000, and 1:10,000 pairs. Number of pairs analyzed was 187,989. E, Mean population data showing the temporal distribution of the first EPSPs that occurred before any EPSP that elicited an LGN spike.

References

    1. Alexander GM, Carden WB, Mu J, Kurukulasuriya NC, McCool BA, Nordskog BK, Friedman DP, Daunais JB, Grant KA, Godwin DW. The native T-type calcium current in relay neurons of the primate thalamus. Neuroscience. 2006;141:453–461. - PubMed
    1. Alitto HJ, Weyand TG, Usrey WM. Distinct properties of stimulus-evoked bursts in the lateral geniculate nucleus. J Neurosci. 2005;25:514–523. - PMC - PubMed
    1. Bishop PO, Burke W, Davis R. Synapse discharge by single fibre in mammalian visual system. Nature. 1958;182:728–730. - PubMed
    1. Bishop PO, Burke W, Davis R. The interpretation of the extracellular response of single lateral geniculate cells. J Physiol (Lond) 1962;162:451–472. - PMC - PubMed
    1. Blasco B, Avendano C, Cavada C. A stereological analysis of the lateral geniculate nucleus in adult Macaca nemestrina monkeys. Vis Neurosci. 1999;16:933–941. - PubMed

Publication types

MeSH terms

LinkOut - more resources