. 2007 Mar 7;27(10):2704-17.
doi: 10.1523/JNEUROSCI.2991-06.2007.

Beta1 integrins control the formation of cell chains in the adult rostral migratory stream

Affiliations

Beta1 integrins control the formation of cell chains in the adult rostral migratory stream

Richard Belvindrah et al. J Neurosci. .

Abstract

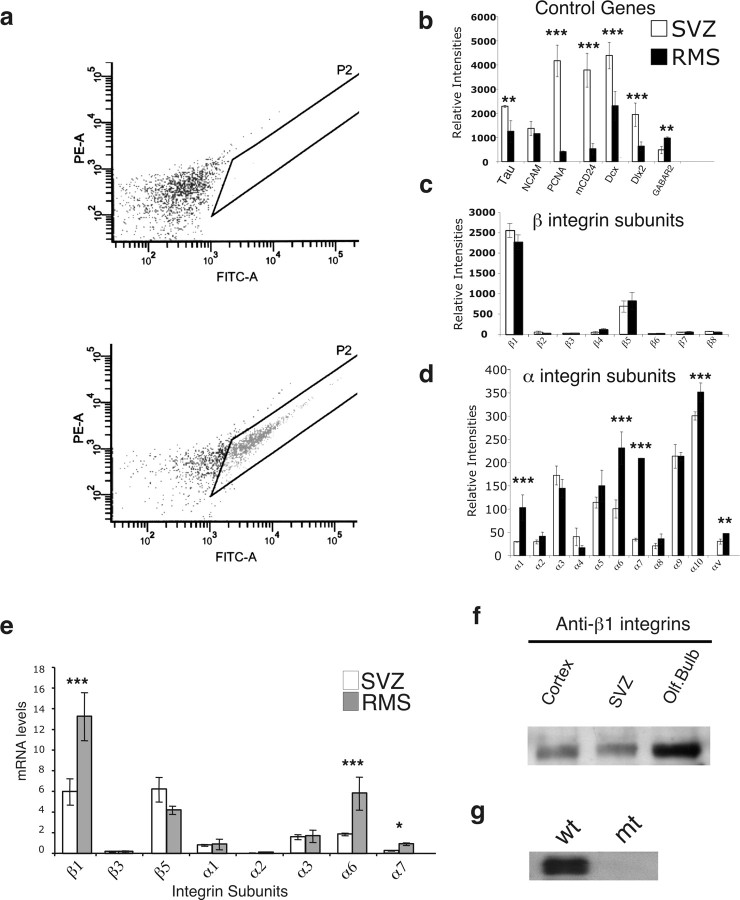
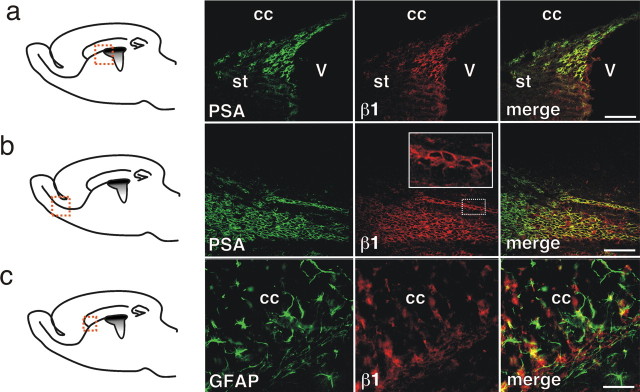
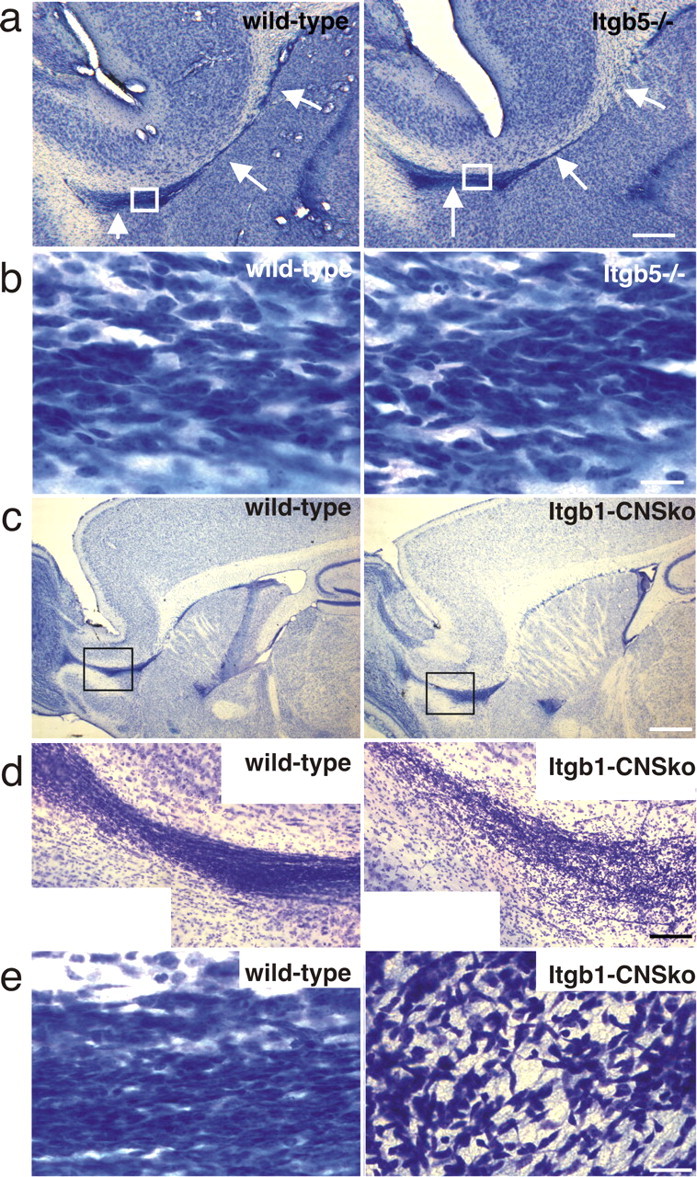
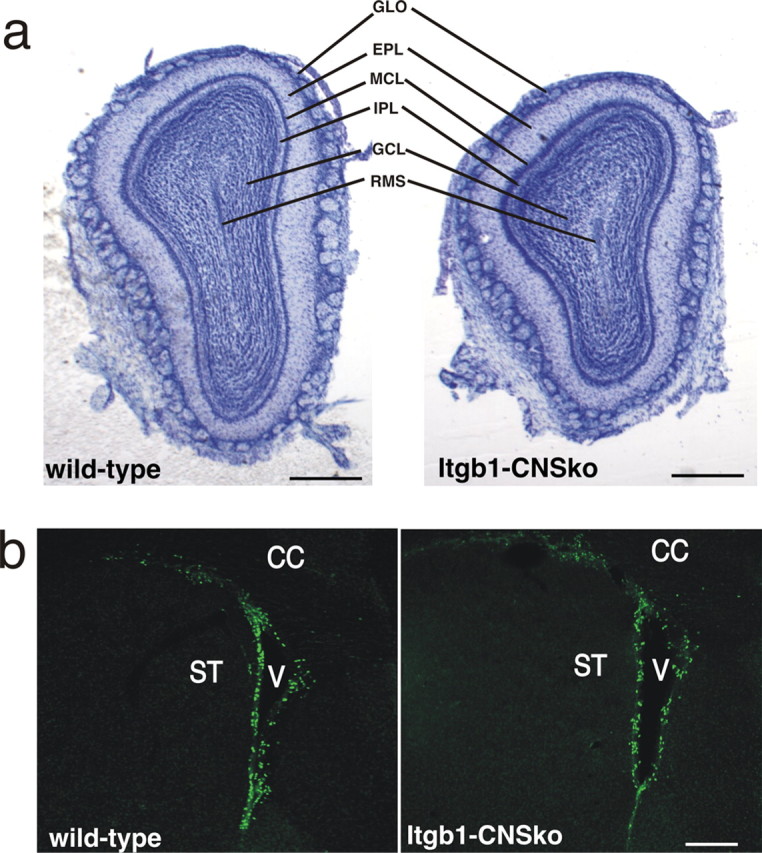
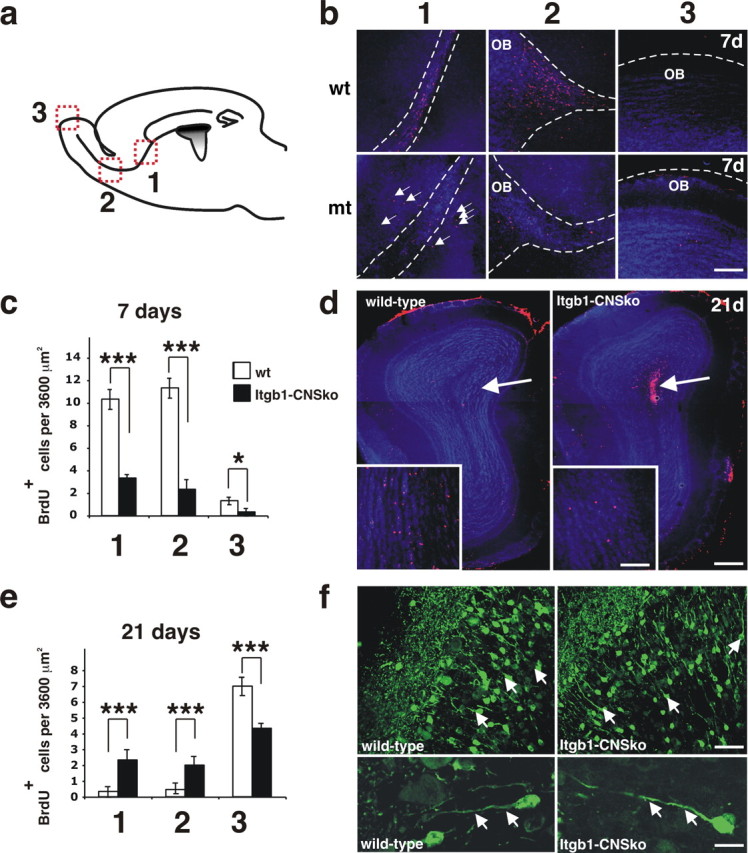
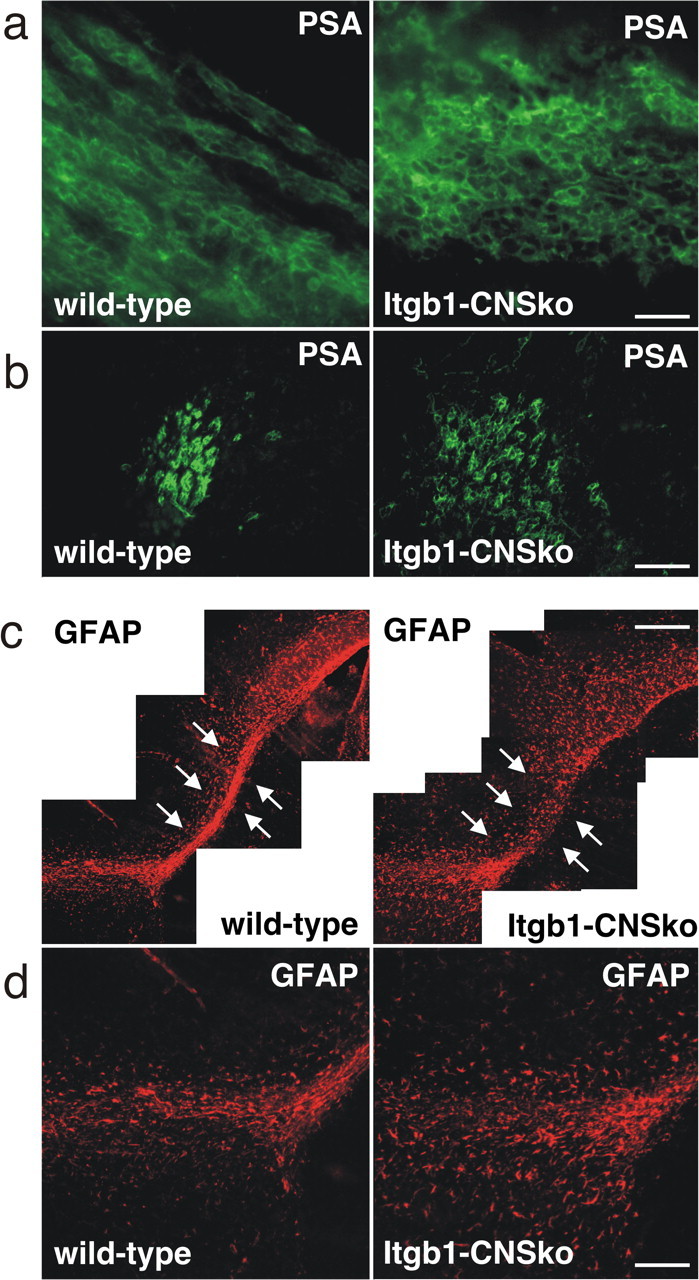
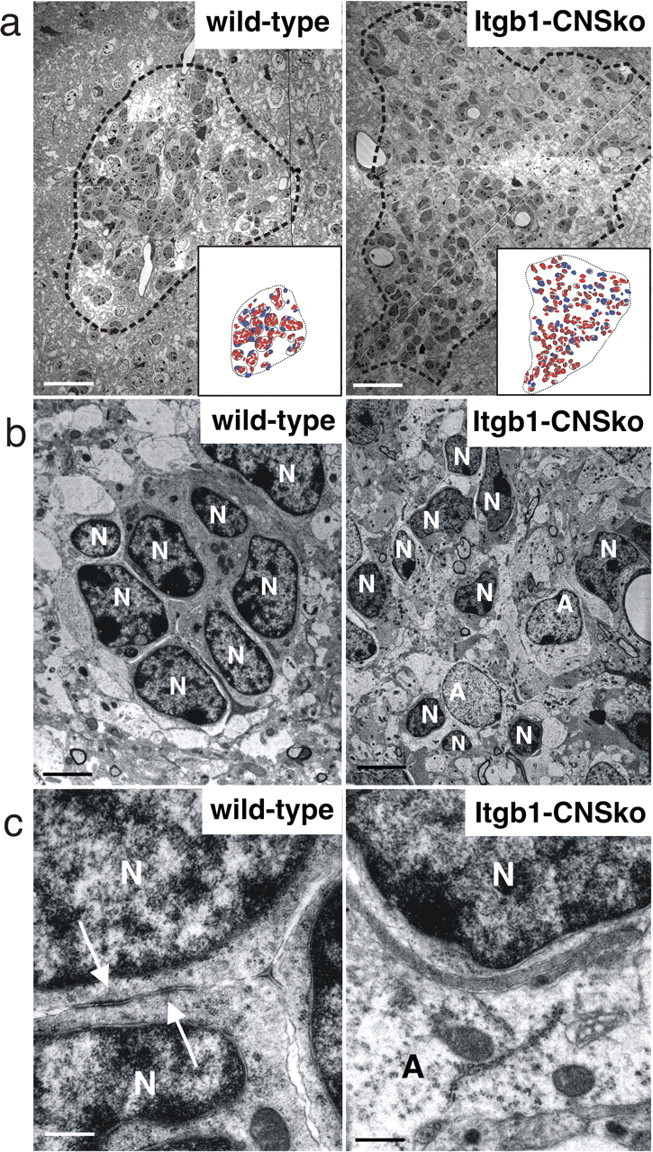
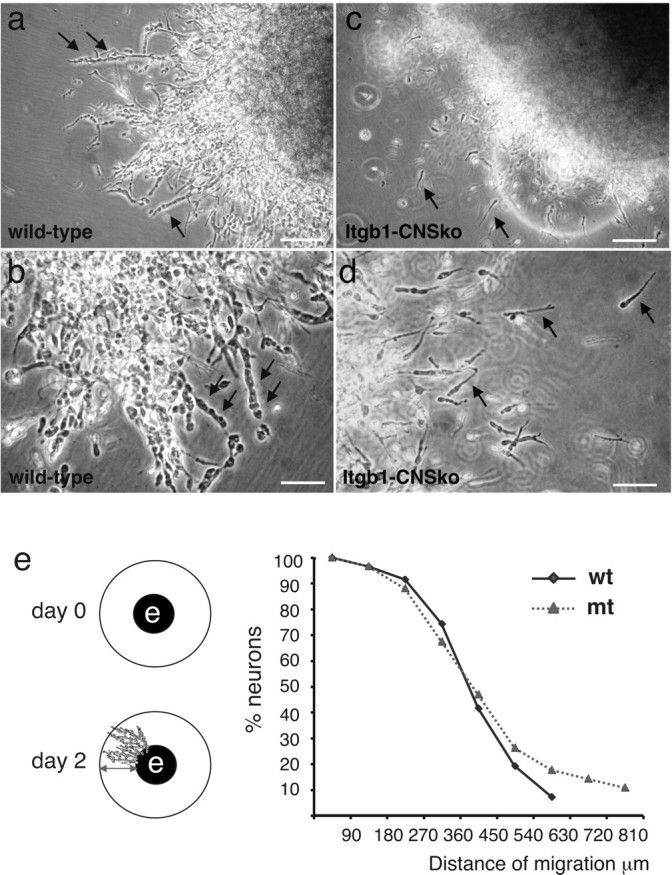
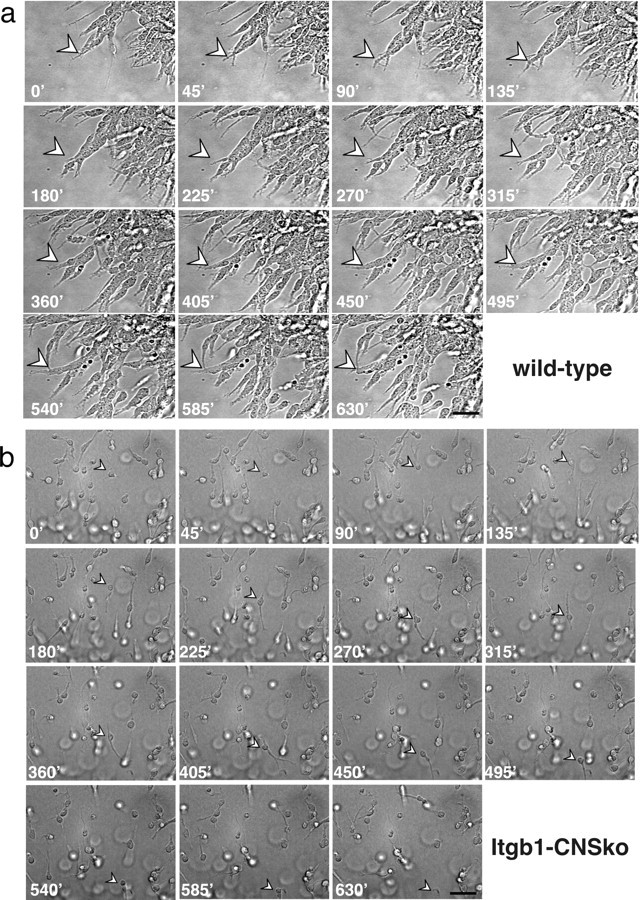
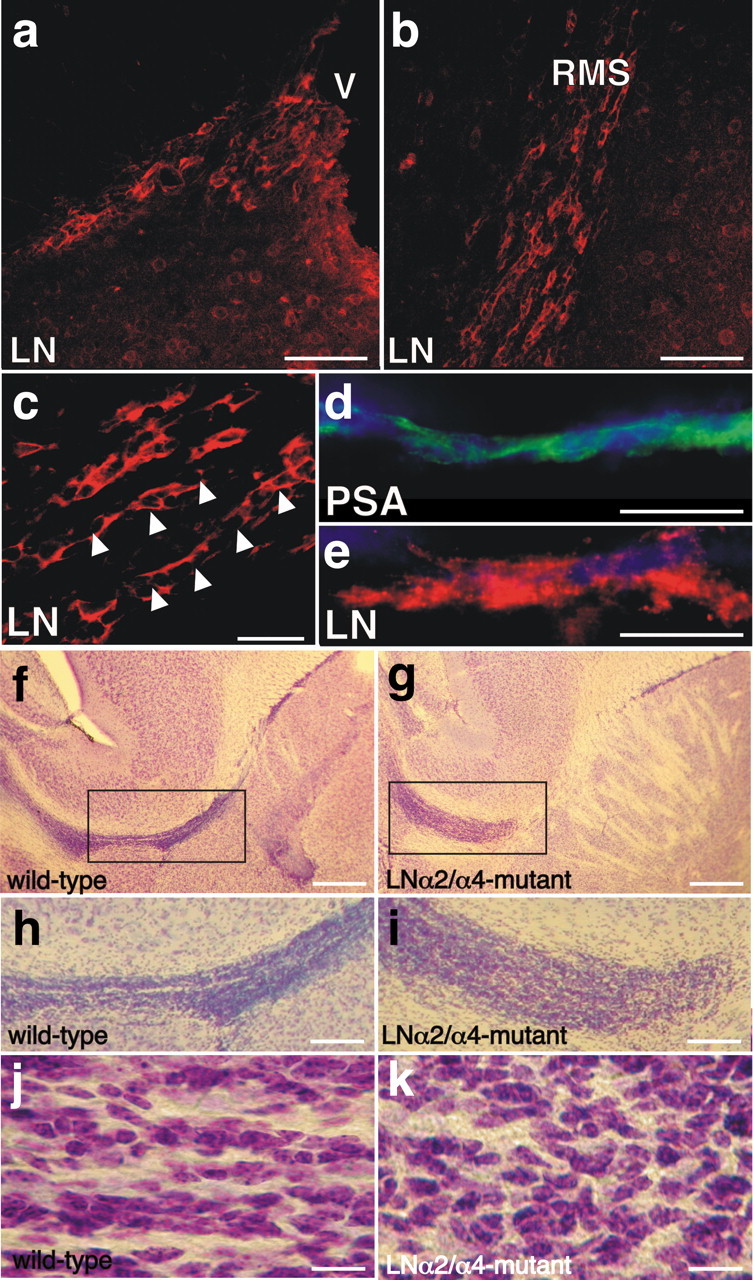
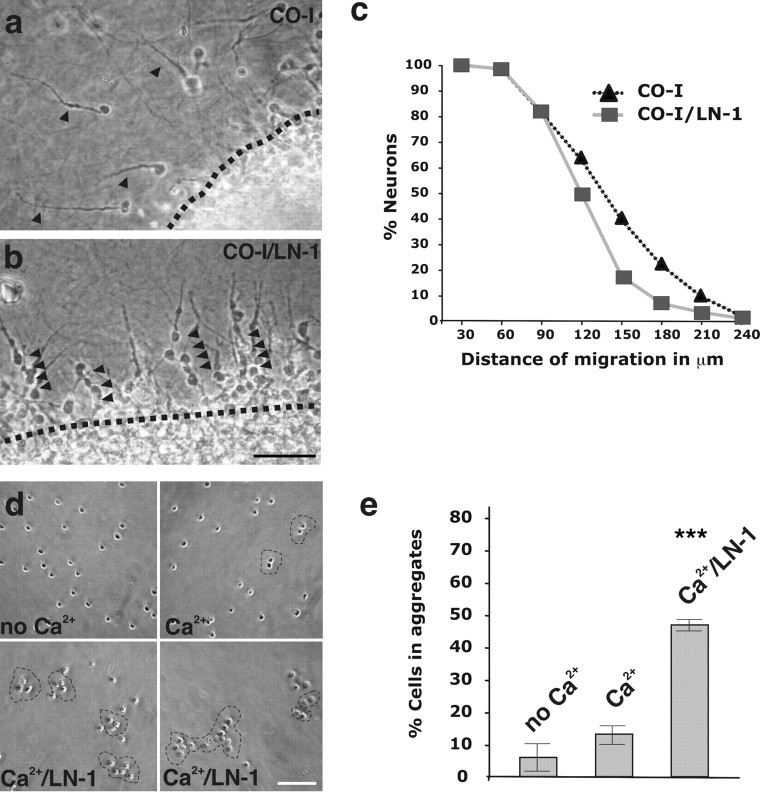
The subventricular zone (SVZ) of the lateral ventricle is the major site of neurogenesis in the adult brain. Neuroblasts that are born in the SVZ migrate as chains along the rostral migratory stream (RMS) to the olfactory bulb. Little is known about the mechanisms that control interactions between neuroblasts during their migration. Here we show that migrating neuroblasts express beta1 integrins and that the integrin ligand laminin is localized to cell chains. Using genetically modified mice and time-lapse video recordings of SVZ explants, we demonstrate that beta1 integrins and laminin promote the formation of cell chains. Laminin also induces the aggregation of purified neuroblasts. We conclude that the formation of cell chains in the RMS is controlled in part by beta1 integrins via binding to laminin. In addition, we provide evidence that beta1 class integrins are required for the maintenance of the glial tubes and that defects in the glial tubes lead to the ectopic migration of neuroblasts into the surrounding tissue.


Figures

Figure 1.
Figure 1.
Analysis of the integrin expression pattern in PSA-NCAM-positive neuroblasts. a, The SVZ was microdissected from adult wild-type mice, and the cells were dissociated and FACS sorted using antibodies to PSA-NCAM. The number of cells is plotted against the fluorescence intensity. The top shows a control without PSA-NCAM antibody. The PSA-NCAM-positive cell population is indicated by the boxed area. b–d, Fluorescence-labeled probes prepared from RNA samples from PSA-NCAM-positive cells from the SVZ and from the RMS were hybridized to Affymetrix gene chips, and the relative signal intensity for different genes was determined as described in Material and Methods. The samples were analyzed for the expression of marker genes (b), β integrin subunits (c), and α integrin subunits (d). The FACS-sorted cells expressed the appropriate markers for PSA-NCAM-positive neuroblasts as well as β1 and β5 integrin subunits. Several integrin α subunits were also expressed, and the relative expression levels of the α1, α6, and α7 subunits were higher in samples from the RMS than SVZ. e, Quantitative reverse transcription-PCR analysis. The mRNA expression levels of the different integrin subunits (expressed as copy number per 1000 copies of GAPDH mRNA) in the SVZ and RMS is indicated. f, The integrin β1 subunit could be detected by Western blots in extracts from the cerebral cortex, SVZ, and OB from P60 mice. g, The integrin β1 subunit was absent in extracts from the forebrain (including the RMS and surrounding tissue) of Itgb1–CNSko mice. wt, Wild type; mt, mutant. *p < 0.05; **p < 0.1; ***p < 0.01.
Figure 2.
Figure 2.
Analysis of the expression pattern of the β1 integrin subunit. a–c, Sagittal sections at the level indicated in the diagrams were stained with antibodies to PSA (green) and the integrin β1 subunit (red). β1 integrins were highly expressed in PSA-positive neuroblasts. The inset in b shows a higher-magnification view of a cell chain demonstrating strong expression of β1 integrins along the cell surface of neuroblasts. c, Sections were stained with antibodies to GFAP (green) and β1 integrins (red). β1 integrins expression was detected in some GFAP-positive cells. V, Ventricle; cc, corpus callosum; st, striatum. Scale bars: a, b, 66 μm; inset in b, 23 μm; c, 50 μm.
Figure 3.
Figure 3.
Defects in the organization of the RMS in mice lacking β1 but not β5 integrins. Sagittal brain sections were prepared from mice of the indicated genotype at P60, and the sections were stained with Nissl. a, b, The RMS (arrows) in Itgb5–null mice did not show any obvious morphological defect when compared with wild-type mice. b shows higher-magnification views of the areas boxed in a. Chains of migrating cells were clearly visible. c, d, The RMS was detectable in Itgb1–CNSko mice. The higher-magnification views in d of the area boxed in c revealed that the RMS in Itgb1–CNSko mice appeared less well organized and compacted than in wild-type mice. e, At even higher magnification, it was apparent that cells in the RMS of Itgb1–CNSko mice were not arranged in organized chains along the rostrocaudal extension of the RMS. Scale bars: a, 225 μm; b, 23 μm; c, 600 μm; d, 90 μm; e, 45 μm.
Figure 4.
Figure 4.
Cell proliferation is not affected in Itgb1–CNSko mice. a, Coronal sections through the OB of adult mice were stained with Nissl. The overall organization of the OB was not altered, and cell layers were clearly distinguishable in Itgb1–CNSko mice. GLO, Glomerular layer; EPL, external plexiform layer; MCL, mitral cell layer; IPL, internal plexiform layer; GCL, granule cell layer; RMS, rostral migratory stream. b, Sagittal sections were prepared 1 h after injecting mice with BrdU, and the sections were stained with antibodies to BrdU (green). Proliferating cells were prominent in the SVZ in wild-type and mutant animals. V, Ventricle; CC, corpus callosum; ST, striatum. Scale bars: a, 385 μm; b, 200 μm.
Figure 5.
Figure 5.
Defects in cell migration in Itgb1–CNSko mice. a–d, Adult mice were injected with BrdU, and sagittal brain sections were prepared 7 and 21 d later. The sections were stained with DAPI (blue) to reveal nuclei and with antibodies to BrdU (red). a, The number of BrdU-positive cells was quantified in the areas labeled with 1, 2, and 3. b, Representative images showing BrdU-labeled cells in areas 1, 2, and 3 after 7 d. The boundaries of the RMS and OB are outlined with dashed lines. The arrows indicate BrdU-positive cells in mutant mice that had migrated out of the RMS into surrounding tissue. c, Quantification of the number of BrdU-positive cells 7 d after BrdU injection in areas 1, 2, and 3. *p < 0.5; ***p < 0.01. d, At 21 d after BrdU labeling, coronal sections at the level of the OB were prepared and stained with DAPI (blue) and antibodies to BrdU (red). Note the accumulation of BrdU-positive cells in the RMS in the center of the OB in the mutants. The insets show higher-magnification views of the granule cell layer. e, Quantification of the number of BrdU-positive cells in areas 1, 2, and 3 at 21 d after BrdU labeling. ***p < 0.01. f, Sagittal sections through the OB were stained with antibodies to calretinin (green) to reveal radially migrating neurons. Note that cells with the typical morphology of radially migrating cells were visible (arrows). The bottom row shows higher-magnification view of radially migrating neurons containing long leading processes (arrows). Scale bars: b, 140 μm; d, 250 μm; inset in d, 88 μm; f, top row, 80 μm; f, bottom row, 16 μm.
Figure 6.
Figure 6.
Itgb1–CNSko mice show defects in the formation of cell chains and disruption of the glial tubes. a, Sagittal sections through the RMS of adult mice were stained with antibodies to PSA-NCAM (green) to reveal migrating neuroblasts. Although neuroblasts in wild-type mice were assembled into chains along the rostrocaudal axis of the RMS, cells in the mutant mice appeared less well organized and did not form clearly recognizable chains. b, Coronal sections through the RMS of adult mice were stained with PSA-NCAM antibodies. Neuroblasts in Itgb1–CNSko mice were more widely dispersed than in wild-type mice. c, d, Sagittal sections through the RMS of adult mice were stained with antibodies to GFAP (red) to reveal the glial tubes. The glial tubes were far less obvious in Itgb1–CNSko than in wild-type mice. Scale bars: a, 30 μm; b, 100 μm; c, 440 μm; d, 200 μm.
Figure 7.
Figure 7.
Disruption of interactions between neuroblasts in Itgb1–CNSko mice. a, Coronal sections through the RMS were analyzed by electron microscopy. Cells in mutant mice were dispersed far more than in wild-type mice. The inset shows the cells color coded (neuroblasts in red, astrocytes in blue). b, Higher-magnification views show that, although neuroblasts (N) formed tight clusters in wild-type mice, they were dispersed in the mutants and astrocytes (A) were interspersed between the neuroblasts. c, In wild-type mice, typical contact zones between neuroblasts were apparent (arrow). In Itgb1–CNSko mice, neuroblasts and astrocytes still tightly aligned their membranes. Scale bars: a, 66 μm; b, 7 and 13 μm; c, 1 μm.
Figure 8.
Figure 8.
β1 integrins control chain formation in Matrigel. a–d, SVZ explants from wild-type and Itgb1–CNSko mice were cultured in Matrigel for 2 d. Wild-type cells emigrated from the explant as chains (arrows in a, b), whereas cells in the mutants migrated as single cells forming long leading processes (arrows in c, d). e, A cumulative frequency distribution plot of the distance of SVZ cell migrating is shown. The values represent pooled data from three independent experiments. There was no significant difference between wild-type and β1-deficient cells in the overall distance traveled. wt, Wild type; mt, mutant. Scale bars: a, c, 125 μm; b, d, 60 μm.
Figure 9.
Figure 9.
Pictures of time-lapse video images of migration assays in Matrigel. The migration of neuroblasts was followed by time-lapse video microscopy (supplemental Movies 1, 2, available at www.jneurosci.org as supplemental material). Pictures from sequential time points (indicated in minutes) are shown. a, A chain of migrating neuroblasts in wild-type mice is marked with an arrowhead. The leading cell developed several protrusions and moved beyond the arrowhead. At ∼315 min, the tip of the chain started to split and cells advanced along two separate pathways. b, Cells in explants from Itgb1–CNSko mice migrated as single cells. The cell marked by the arrowhead formed a leading process, and the cell body translocated along the process toward the tip of the leading process. At 180 min, a new leading process developed at the opposite end of the cell body, and the cell started to reverse its direction of migration. Scale bars: a, 46 μm; b, 58 μm.
Figure 10.
Figure 10.
Laminin is required for chain migration. a–e, Sagittal sections through the RMS close to the ventricle (a) and close to the OB (b) were stained with antibodies that recognize laminin α1 and α2. The two laminin subunits were highly expressed in the RMS and concentrated around cells. c shows a higher-magnification view of neuroblasts in cell chains. d and e are of the same chain stained with DAPI (blue) and antibodies to PSA (green) or to laminin α1/α2 (red). Note that laminin α1/α2 was concentrated at the surface of the neuroblasts within cell chains (arrowheads in c). f–k, Sagittal sections from 4-week-old wild-type mice and laminin α2/α4 double-mutant mice were stained with Nissl. Images in h and i are higher-magnification views of the areas boxed in f and g. Note that the RMS is less compact in the mutants. j, k, At high magnification, neuroblasts in cell chains that were aligned along the rostrocaudal axis of the RMS could be detected in wild-type mice but not in the mutants. Scale bars: a, b, 150 μm; c, 60 μm; d, e, 46 μm; f, g, 255 μm; h, i, 108 μm; j, k, 50 μm.
Figure 11.
Figure 11.
Laminin promotes chain formation and neuroblast aggregation in vitro. a, b, SVZ explants from wild-type mice were cultured in collagen gels or in mixed collagen (CO)/laminin-1 (LN) gels. Note that, although cells in collagen gels migrated at single cells, they were assembled into chains (arrowheads) in mixed collagen/laminin-1 gels. c, Cumulative frequency plot of the distance traveled by cell revealed that cells in chains migrated slightly less far than single cells, suggesting that overall migration speed was reduced when cells were assembled into chains. The values represent pooled data from three independent experiments. d, FACS-sorted PSA-NCAM-positive cells were incubated for 2 h in buffer with or without Ca2+ and with or without laminin-1. Cell aggregation was only observed in the presence of Ca2+ and laminin-1. e, Quantification of cell aggregation in three independent experiments. The mean and SE is shown; ***p < 0.01. Scale bars: a, b, 100 μm; d, 90 μm.

References

    1. Adelsman MA, McCarthy JB, Shimizu Y. Stimulation of beta1-integrin function by epidermal growth factor and heregulin-beta has distinct requirements for erbB2 but a similar dependence on phosphoinositide 3-OH kinase. Mol Biol Cell. 1999;10:2861–2878. - PMC - PubMed
    1. Alvarez-Buylla A, Garcia-Verdugo JM. Neurogenesis in adult subventricular zone. J Neurosci. 2002;22:629–634. - PMC - PubMed
    1. Alvarez-Buylla A, Lim DA. For the long run: maintaining germinal niches in the adult brain. Neuron. 2004;41:683–686. - PubMed
    1. Andressen C, Adrian S, Fassler R, Arnhold S, Addicks K. The contribution of beta1 integrins to neuronal migration and differentiation depends on extracellular matrix molecules. Eur J Cell Biol. 2005;84:973–982. - PubMed
    1. Anton ES, Ghashghaei HT, Weber JL, McCann C, Fischer TM, Cheung ID, Gassmann M, Messing A, Klein R, Schwab MH, Lloyd KC, Lai C. Receptor tyrosine kinase ErbB4 modulates neuroblast migration and placement in the adult forebrain. Nat Neurosci. 2004;7:1319–1328. - PubMed

Publication types

LinkOut - more resources