. 2007 May;18(5):1826-38.
doi: 10.1091/mbc.e06-09-0820. Epub 2007 Mar 7.

Yeast formins Bni1 and Bnr1 utilize different modes of cortical interaction during the assembly of actin cables

Affiliations

Yeast formins Bni1 and Bnr1 utilize different modes of cortical interaction during the assembly of actin cables

Shawnna M Buttery et al. Mol Biol Cell. 2007 May.

Abstract

The budding yeast formins Bni1 and Bnr1 control the assembly of actin cables. These formins exhibit distinct patterns of localization and polymerize two different populations of cables: Bni1 in the bud and Bnr1 in the mother cell. We generated a functional Bni1-3GFP that improved the visualization of Bni1 in vivo at endogenous levels. Bni1 exists as speckles in the cytoplasm, some of which colocalize on actin cables. These Bni1 speckles display linear, retrograde-directed movements. Loss of polymerized actin or specifically actin cables abolished retrograde movement, and resulted in depletion of Bni1 speckles from the cytoplasm, with enhanced targeting of Bni1 to the bud tip. Mutations that impair the actin assembly activity of Bni1 abolished the movement of Bni1 speckles, even when actin cables were present. In contrast, Bnr1-GFP or 3GFP-Bnr1 did not detectably associate with actin cables and was not observed as cytoplasmic speckles. Finally, fluorescence recovery after photobleaching demonstrated that Bni1 was very dynamic, exchanging between polarized sites and the cytoplasm, whereas Bnr1 was confined to the bud neck and did not exchange with a cytoplasmic pool. In summary, our results indicate that formins can have distinct modes of cortical interaction during actin cable assembly.


Figures

Figure 1.
Figure 1.
Localization of Bni1 to actin cables. (A) Bni1-3GFP localization during the cell cycle. Shown are images of Bni1-3GFP in fixed cells. Note: Bni1 can be observed as speckles in the cytoplasm in addition to its enrichment at the bud tip and later in the cell cycle at the bud neck. Each panel is a maximum projection image generated from a series of 0.3-μm stacks through the entire cell. (B and C) Colocalization of Bni1-3YFP with actin cables. Fixed cells labeled with Bni1-3YFP and Abp140-3CFP. Abp140 labels actin cables brightly as well as actin patches. Right, merged images. Arrows indicate colocalization (yellow) of Bni1 (red) on Abp140-labeled actin cables (green). Each panel is a single focal plane image (n > 100 cells). Scale bars, 2 μm.
Figure 2.
Figure 2.
Retrograde movement of Bni1-3GFP. (A) Bni1-3GFP speckles move from the bud tip toward the bud neck. Shown are time-lapse images of two different Bni1-3GFP speckles (first speckle indicated by arrow; second by arrowhead) that move linearly in the same G2/M phase cell. Time is in milliseconds. (B) Time-lapse images of Bni1-3GFP speckles that move from the bud neck into the daughter in an anaphase cell (arrow). (C) Histogram comparing the rate of Bni1-3GFP movement and the rate of actin cable extension, as measured by Abp140-3GFP movement. n = 71 for Bni1 speckles; n = 66 for actin cables marked with Abp140-3GFP. Scale bar, 2 μm.
Figure 3.
Figure 3.
Actin disassembly results in an enrichment of Bni1-3GFP at the bud tip with depletion of Bni1-3GFP speckles from the cytoplasm. Time-lapse images of Bni1-3GFP after treatment with 100 μM (A) or 400 μM (B) LatA for 1 min. Numbers indicate the time from the start of filming. (C) Ratio of the fluorescence intensity (fl. int. ratio) of Bni1-3GFP in the bud to the intensity in the mother at the time points in the images in A (■) and B (•). Control sample is treated with DMSO (▴). Note that fluorescence intensity ratio is normalized to 1 at time point 0. Scale bar, 2 μm.
Figure 4.
Figure 4.
Bud6 and Bni1 colocalize at sites of polarized growth, but not on actin cables or in cytoplasmic speckles. Colocalization (yellow) of Bni1-3GFP (green) with Bud6-RFP (red). Note: although there is colocalization at the bud tip, there is little if any colocalization of cytoplasmic speckles. Each panel is a maximum projection image generated from a series of deconvolved 0.3-μm stacks. Scale bar, 2 μm.
Figure 5.
Figure 5.
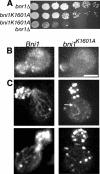
A mutation disrupting actin binding (Bni1-K1601A) depletes cytoplasmic speckles and disrupts actin cables. (A) Bni1K1601A shows a temperature-sensitive growth defect in bnr1Δ strains. Dilution of cells spotted onto YPD plates, grown at 37°C for 1 d. (B) Bni1K1601A-3GFP is more enriched at the bud tip. Images of the Bni1-3GFP and Bni1K1601A-3GFP in strains lacking Bnr1. (C) Actin cable assembly is impaired in Bni1K1601A-3GFP bnr1Δ strains. Phalloidin-labeled Bni1K1601A-3GFP bnr1Δ strains contain a few actin cables at 24°C (arrow). After 1 h at 37°C, the cells lack cables (C, right). Images on the left show the phalloidin staining of Bni1-3GFP in bnr1Δ. Pictures in B are single focal planes images; C shows deconvolved, maximum intensity projections generated from 0.2-μm stacks. Scale bar, 2 μm.
Figure 6.
Figure 6.
Bni1-3GFP speckles turn over rapidly at the bud neck and bud tip, whereas Bnr1 is relatively static at the bud neck. (A) Four examples of FRAP experiments to characterize the turnover of Bni1-3GFP after photobleaching at the bud tip. Although turnover is always rapid, these examples illustrate the variability in recovery rates. Time is in seconds. (B) Rapid turnover of Bni1-3GFP at the bud neck. Left, time-lapse images from one experiment. Right, average relative fluorescence intensity (RFI) after photobleaching for Bni1-3GFP at the bud neck (n = 4). (C) Lack of turnover of Bnr1-GFP at the neck. Left, images of a cell from one experiment; below each image an enlargement of the neck region is presented. Right, average RFI after photobleaching for Bnr1-GFP at the bud neck (n = 6). (D) Lateral diffusion of Bnr1 at the bud neck. Bleaching of half of the Bnr1-GFP bud neck signal enables slow recovery of signal from the bleached region with concomitant loss of signal from the unbleached region. Left, images from one experiment; below each image an enlargement of the neck region is presented. Right, average RFI after photobleaching for Bnr1-GFP at the bud neck for the bleached half (■) versus the unbleached half (▴; n = 4). For all images, the zero time point is the first postbleach image; subsequent times (in seconds) are indicated. Scale bar, 5 μm.
Figure 7.
Figure 7.
Bni1-3GFP was visualized as fluorescent speckles in the cytoplasm, whereas 3GFP-Bnr1 brightly labels the bud neck, but does not produce cytoplasmic speckles. Images are maximum intensity projections generated from 0.3-μm stacks of fixed cells of the indicated genotype. Note: we observe some fluorescent signal in the cytoplasm of both 3GFP-BNR1 and control 3GFP-CEN strains. This signal is not dynamic, does not colocalize with actin, and was readily distinguished from cytoplasmic Bni1 speckles. Scale bar, 5 μm.
Figure 8.
Figure 8.
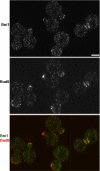
Bnr1 is lost from the bud neck during cytokinesis. (A) Dual-color imaging of Bnr1-GFP and Myo1-CFP. Arrows indicate colocalization (yellow) of Bnr1 (red) with Myo1 (green) in cells with small- to medium-sized buds before cytokinesis. Scale bar, 2 μm (B) Time-lapse images of cells labeled with Bnr1-GFP (red) and Myo1-CFP (green). Note that Bnr1 is lost from the bud neck during CAR constriction. Each frame is 1 min. Each panel is a single focal plane image. Scale bar, 5 μm.
Figure 9.
Figure 9.
Bni1- and Bnr1-nucleated cables display similar variations in fluorescence intensity. Phalloidin-labeled cells with the indicated genotypes in homozygous diploid strains. Arrows indicate discontinuous regions of increased fluorescence intensity along the actin cable. Images were deconvolved and maximum intensity projections were generated from 0.3-μm stacks. The fluorescence intensity (fl. int.) in arbitrary units versus the length of the cable from top to bottom was measured for each of the pseudocolored cables in the cell above each graph. Scale bar, 2 μm.

References

    1. Abe M., Qadota H., Hirata A., Ohya Y. Lack of GTP-bound Rho1p in secretory vesicles of Saccharomyces cerevisiae. J. Cell Biol. 2003;162:85–97. - PMC - PubMed
    1. Amatruda J. F., Cooper J. A. Purification, characterization, and immunofluorescence localization of Saccharomyces cerevisiae capping protein. J. Cell Biol. 1992;117:1067–1076. - PMC - PubMed
    1. Amatruda J. F., Gattermeir D. J., Karpova T. S., Cooper J. A. Effects of null mutations and overexpression of capping protein on morphogenesis, actin distribution and polarized secretion in yeast. J. Cell Biol. 1992;119:1151–1162. - PMC - PubMed
    1. Amberg D. C., Zahner J. E., Mulholland J. W., Pringle J. R., Botstein D. Aip3p/Bud6p, a yeast actin-interacting protein that is involved in morphogenesis and the selection of bipolar budding sites. Mol. Biol. Cell. 1997;8:729–753. - PMC - PubMed
    1. Asakura T., et al. Isolation and characterization of a novel actin filament-binding protein from Saccharomyces cerevisiae. Oncogene. 1998;16:121–130. - PubMed

Publication types

MeSH terms

LinkOut - more resources