. 2007 Jan;87(1):5-24.
doi: 10.1901/jeab.2007.55-05.

Resurgence of integrated behavioral units

Affiliations

Resurgence of integrated behavioral units

Gustavo Bachá-Méndez et al. J Exp Anal Behav. 2007 Jan.

Abstract

Two experiments with rats examined the dynamics of well-learned response sequences when reinforcement contingencies were changed. Both experiments contained four phases, each of which reinforced a 2-response sequence of lever presses until responding was stable. The contingencies then were shifted to a new reinforced sequence until responding was again stable. Extinction-induced resurgence of previously reinforced, and then extinguished, heterogeneous response sequences was observed in all subjects in both experiments. These sequences were demonstrated to be integrated behavioral units, controlled by processes acting at the level of the entire sequence. Response-level processes were also simultaneously operative. Errors in sequence production were strongly influenced by the terminal, not the initial, response in the currently reinforced sequence, but not by the previously reinforced sequence. These studies demonstrate that sequence-level and response-level processes can operate simultaneously in integrated behavioral units. Resurgence and the development of integrated behavioral units may be dissociated; thus the observation of one does not necessarily imply the other.


Figures

Fig 1
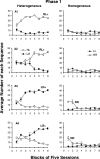
Fig 1. Each graph shows the average number of each response sequence observed in Phase 1 for each subject in Experiment 1, depicted over blocks of five sessions.
The two heterogeneous sequences are depicted in the left panels, and the homogeneous sequences are depicted in the right panels. Phase 1 reinforced a heterogeneous sequence, depicted in the left panels as LR+ or RL+. Error bars represent one standard error.
Fig 2
Fig 2. Each graph shows the average number of each response sequence observed in Phase 2 for each subject in Experiment 1, depicted over blocks of five sessions.
The two heterogeneous sequences are depicted in the left panels, and the homogeneous sequences are depicted in the right panels. Phase 2 reinforced a heterogeneous sequence, depicted in the left panels as LR+ or RL+. Error bars represent one standard error.
Fig 3
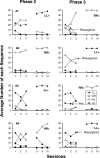
Fig 3. The left panels depict all four sequence types observed in Phase 3, and the right panels depict Phase 4, for each subject in Experiment 1.
Each graph shows the frequencies of each sequence across individual sessions, rather than across blocks of sessions. The first three sessions and the last three sessions of each phase are depicted in order to emphasize acquisition and the final steady-state levels of each sequence. Phases 3 and 4 reinforced homogeneous sequences, depicted in each panel as LL+ or RR+. Extinction-induced resurgence of a previously reinforced response sequence is identified in the right panels by arrows.
Fig 4
Fig 4. The frequency of occurrence of the resurgent sequence is compared to the frequency of the other heterogeneous sequence, averaged across subjects, for each of the first three sessions of Phase 4 in Experiment 1.
Error bars represent one standard error.
Fig 5
Fig 5. Each graph shows the average number of each response sequence observed in Phase 1 for each subject in Experiment 2, depicted over blocks of five sessions.
The two heterogeneous sequences are depicted in the left panels, and the homogeneous sequences are depicted in the right panels. Phase 1 reinforced a heterogeneous sequence, depicted in the left panels as LR+ or RL+. Error bars represent one standard error.
Fig 6
Fig 6. The left panels depict all four sequence types observed in Phase 2, and the right panels depict Phase 3, for each subject in Experiment 2.
Each graph shows the frequencies of each sequence across individual sessions, rather than across blocks of sessions. The first three sessions and the last three sessions of each phase are depicted in order to emphasize acquisition and the final steady-state levels of each sequence. Phases 2 and 3 reinforced homogeneous sequences, depicted in each panel as LL+ or RR+. Extinction-induced resurgence of a previously reinforced response sequence is identified in the right panels by arrows.
Fig 7
Fig 7. The frequency of occurrence of the resurgent sequence is compared to the frequency of the other heterogeneous sequence, averaged across subjects, for each of the first three sessions of Phase 3 in Experiment 2.
Error bars represent one standard error.
Fig 8
Fig 8. Each graph shows the average number of each response sequence observed in Phase 4 for each subject in Experiment 2, depicted over blocks of five sessions.
The two heterogeneous sequences are depicted in the left panels, and the homogeneous sequences are depicted in the right panels. Phase 4 reinforced a heterogeneous sequence, depicted in the left panels as LR+ or RL+. Error bars represent one standard error.
Fig 9
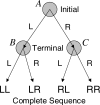
Fig 9. This conditional decision tree represents the response-by-response choices as responses are produced to form response sequences.
The letter A represents the choice point for the initial response of the sequence. Letters B and C represent the choice points for the second, terminal response that terminates the two-response sequence.

Similar articles

Cited by

References

    1. Arbuckle J.L, Lattal K.A. Changes in functional response units with briefly delayed reinforcement. Journal of the Experimental Analysis of Behavior. 1988;49:249–263. - PMC - PubMed
    1. Baum W.M. From molecular to molar: A paradigm shift in behavior analysis. Journal of the Experimental Analysis of Behavior. 2002;78:95–116. - PMC - PubMed
    1. Catania A.C. Reinforcement schedules: The role of responses preceding the one that produces the reinforcer. Journal of the Experimental Analysis of Behavior. 1971;15:271–287. - PMC - PubMed
    1. Cleland B.S, Guerin B, Foster T.M, Temple W. On terms: Resurgence. The Behavior Analyst. 2001;24:255–260. - PMC - PubMed
    1. Corbit L.H, Balleine B.W. Instrumental and Pavlovian incentive processes have dissociable effects on components of a heterogeneous instrumental chain. Journal of Experimental Psychology: Animal Behavior Processes. 2003;29:99–106. - PubMed

LinkOut - more resources