

Functional tissue pulsatility imaging of the brain during visual stimulation
- PMID: 17346872
- PMCID: PMC1995427
- DOI: 10.1016/j.ultrasmedbio.2006.11.008
Functional tissue pulsatility imaging of the brain during visual stimulation
Abstract
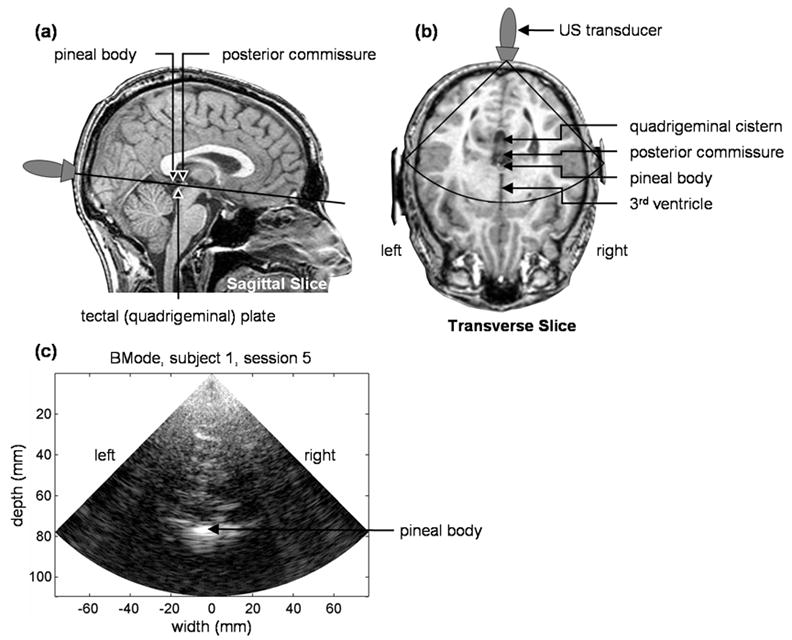
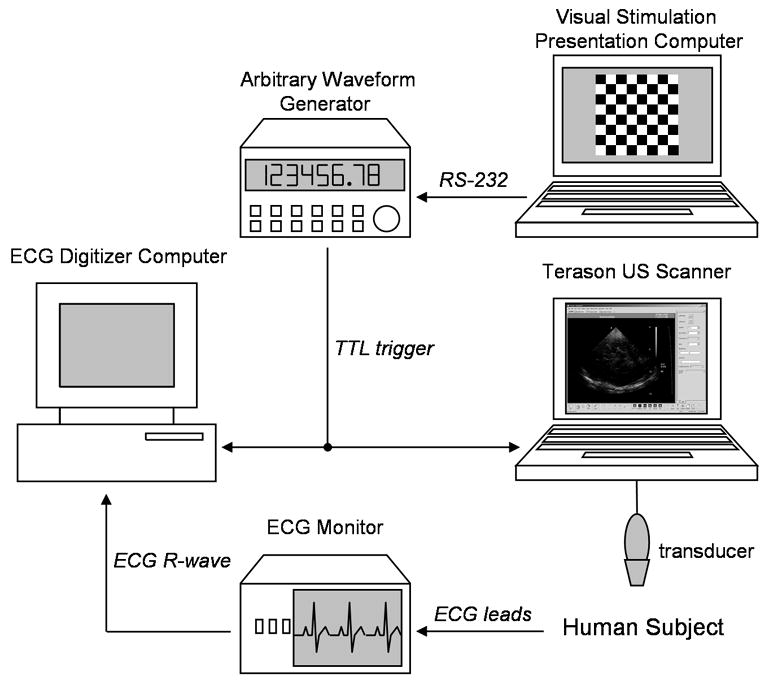
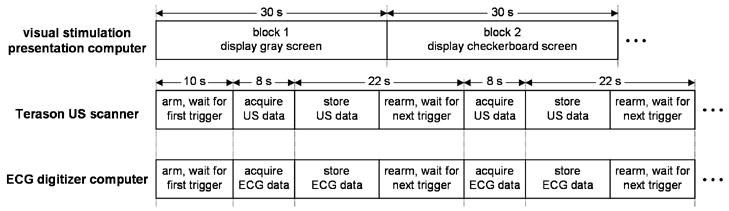
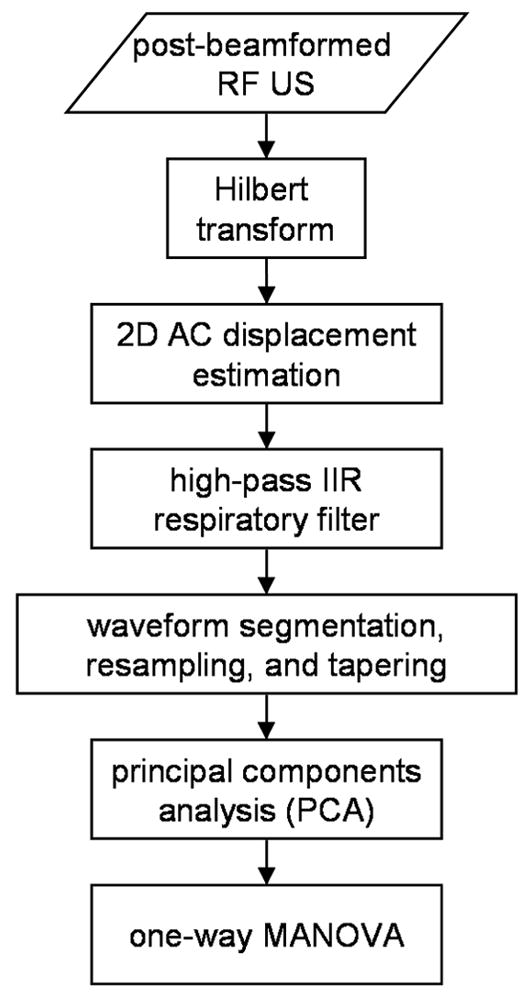
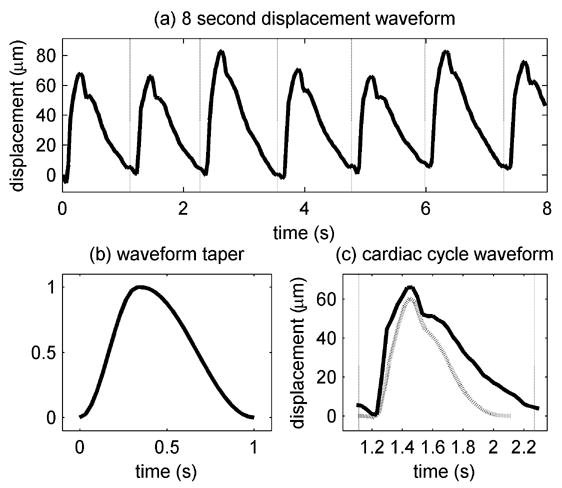
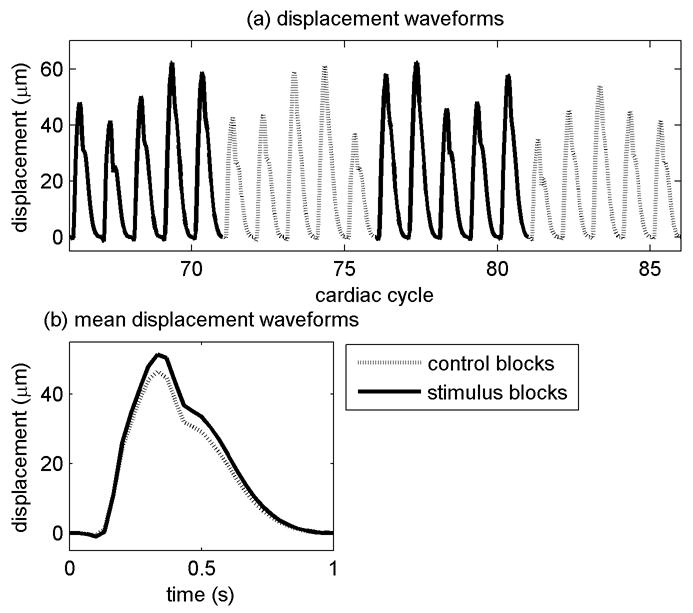
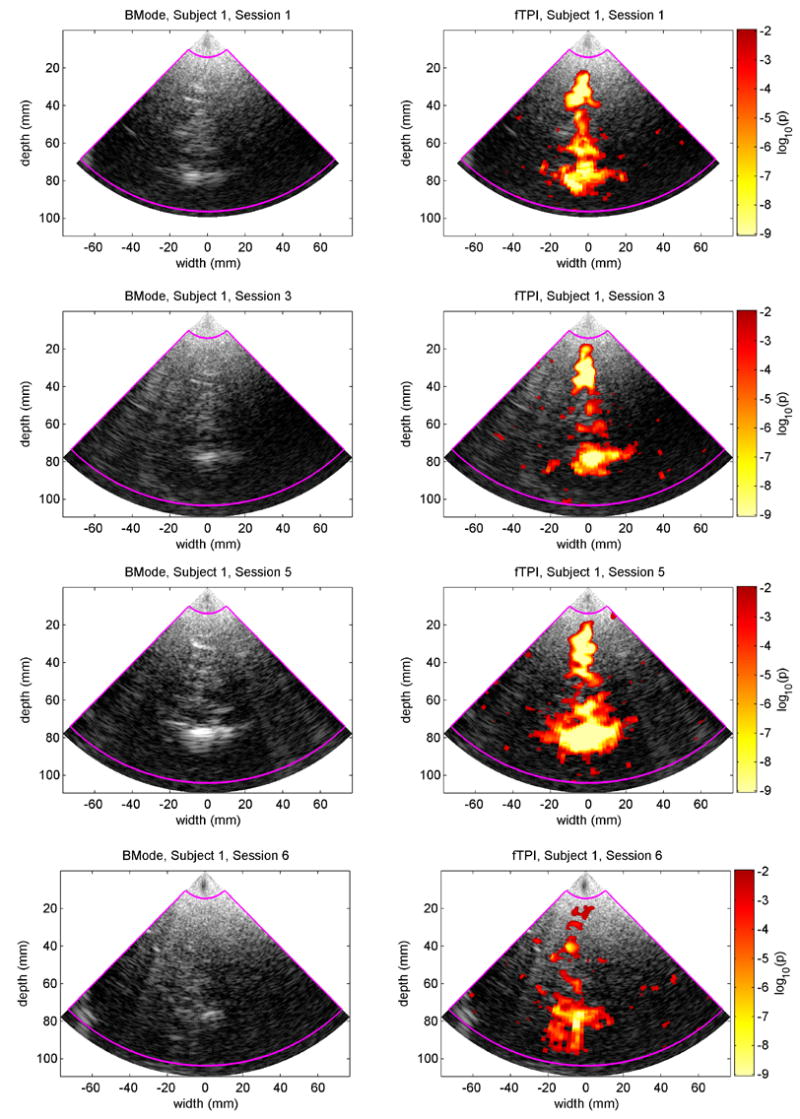
Functional tissue pulsatility imaging is a new ultrasonic technique being developed to map brain function by measuring changes in tissue pulsatility as a result of changes in blood flow with neuronal activation. The technique is based in principle on plethysmography, an older, nonultrasound technology for measuring expansion of a whole limb or body part as a result of perfusion. Perfused tissue expands by a fraction of a percent early in each cardiac cycle when arterial inflow exceeds venous outflow, and it relaxes later in the cardiac cycle when venous drainage dominates. Tissue pulsatility imaging (TPI) uses tissue Doppler signal processing methods to measure this pulsatile "plethysmographic" signal from hundreds or thousands of sample volumes in an ultrasound image plane. A feasibility study was conducted to determine if TPI could be used to detect regional brain activation during a visual contrast-reversing checkerboard block paradigm study. During a study, ultrasound data were collected transcranially from the occipital lobe as a subject viewed alternating blocks of a reversing checkerboard (stimulus condition) and a static, gray screen (control condition). Multivariate analysis of variance was used to identify sample volumes with significantly different pulsatility waveforms during the control and stimulus blocks. In 7 of 14 studies, consistent regions of activation were detected from tissue around the major vessels perfusing the visual cortex.
Figures

References
-
- Aaslid R, Markwalder TM, Nornes H. Noninvasive transcranial Doppler ultrasound recording of flow velocity in basal cerebral arteries. J Neurosurg. 1982;57(6):769–74. - PubMed
-
- Aaslid R. Visually evoked dynamic blood flow response of the human cerebral circulation. Stroke. 1987;18(4):771–775. - PubMed
-
- Asil T, Uzuner N. Differentiation of vascular dementia and Alzheimer disease: a functional transcranial Doppler ultrasonographic study. J Ultrasound Med. 2005;24(8):1065–1070. - PubMed
-
- Backer M, Sander D, Hammes MG, Funke D, Deppe M, Conrad B, Tolle TR. Altered cerebrovascular response pattern in interictal migraine during visual stimulation. Cephalalgia. 2001;21(5):611–616. - PubMed
-
- Beach KW, Philips DJ, Kansky J. Ultrasonic plethysmograph. US Patent #. 5,088,498. 1992.
Publication types
MeSH terms
Grants and funding
LinkOut - more resources
Full Text Sources
Other Literature Sources
Miscellaneous
