. 2007 Mar;26(3):345-55.
doi: 10.1016/j.immuni.2007.01.013. Epub 2007 Mar 8.

The stimulatory potency of T cell antigens is influenced by the formation of the immunological synapse

Affiliations

The stimulatory potency of T cell antigens is influenced by the formation of the immunological synapse

Saso Cemerski et al. Immunity. 2007 Mar.

Abstract

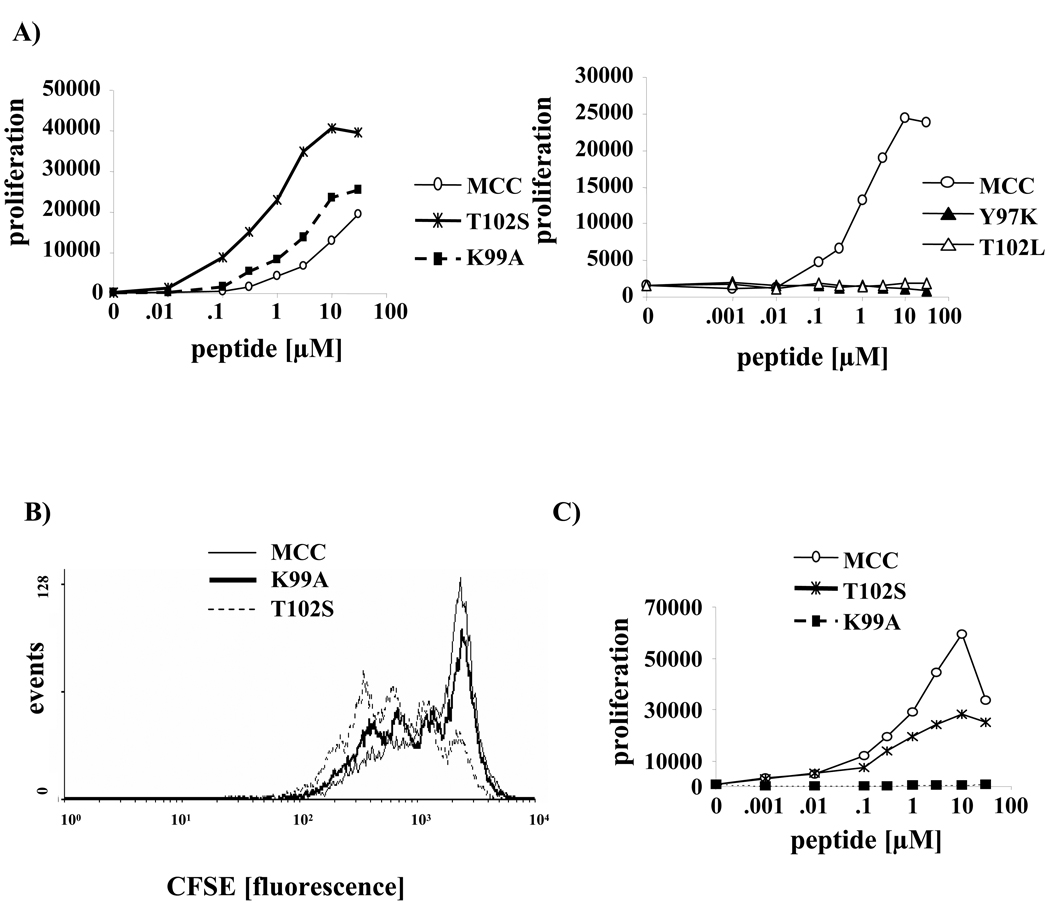
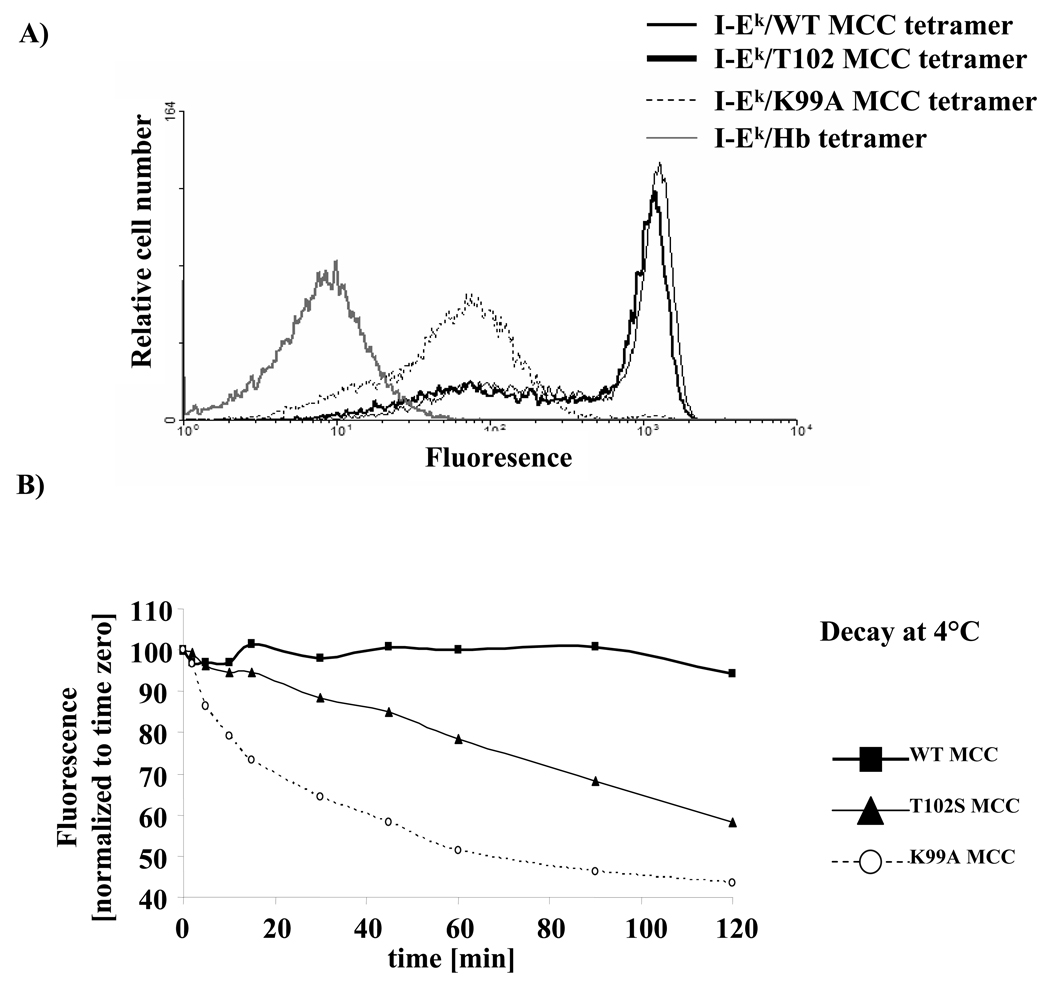
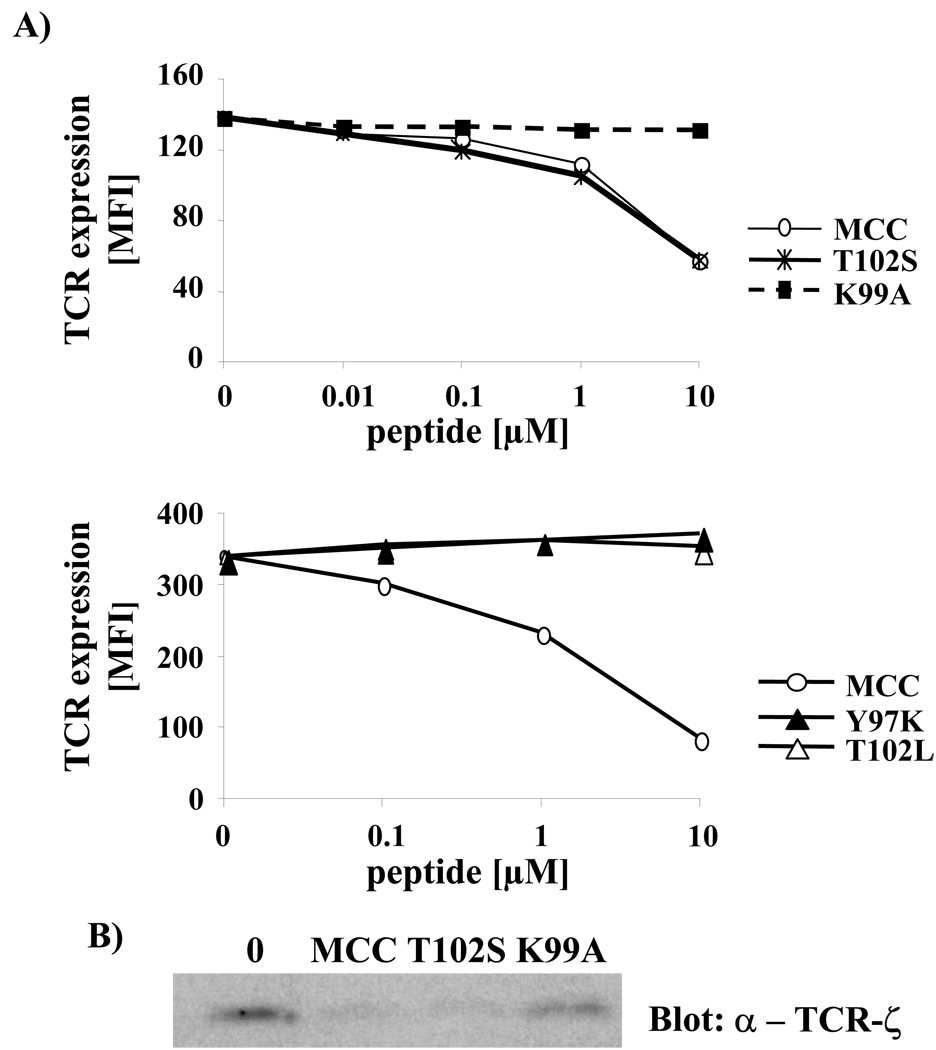
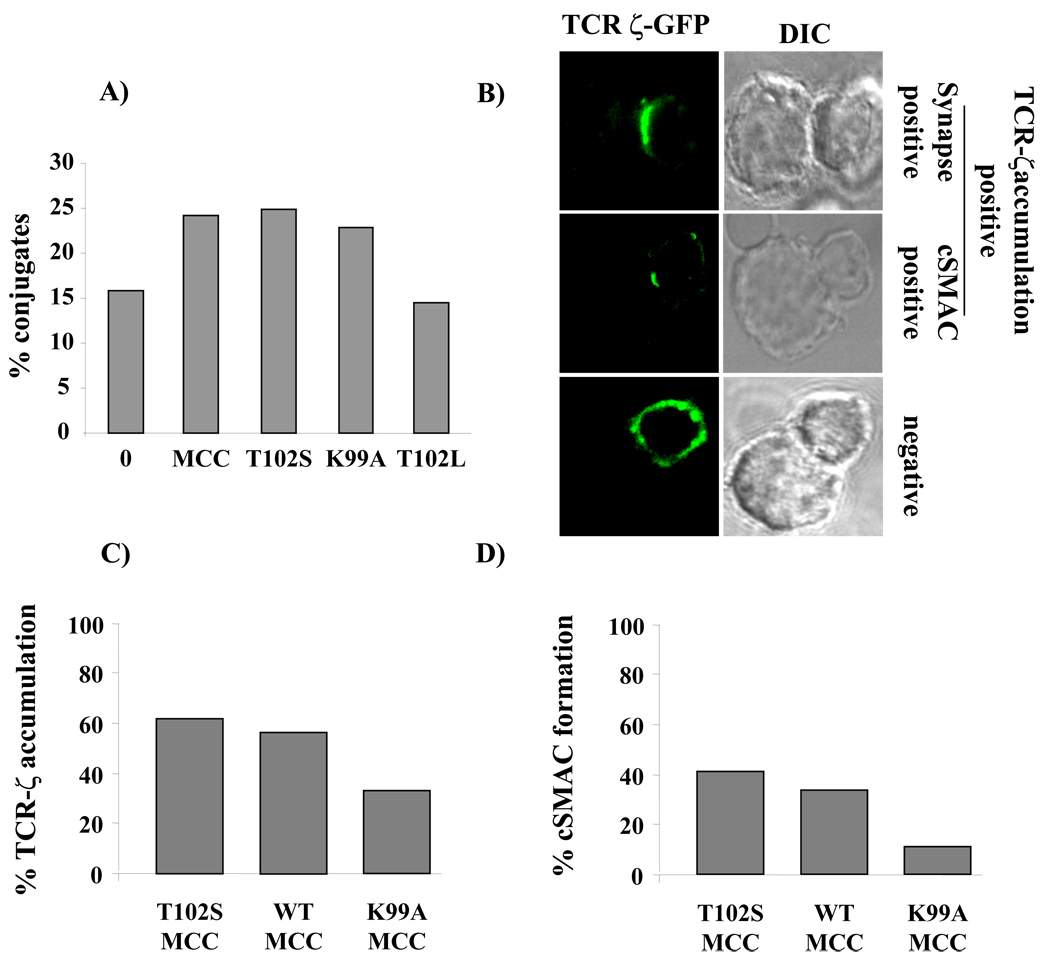
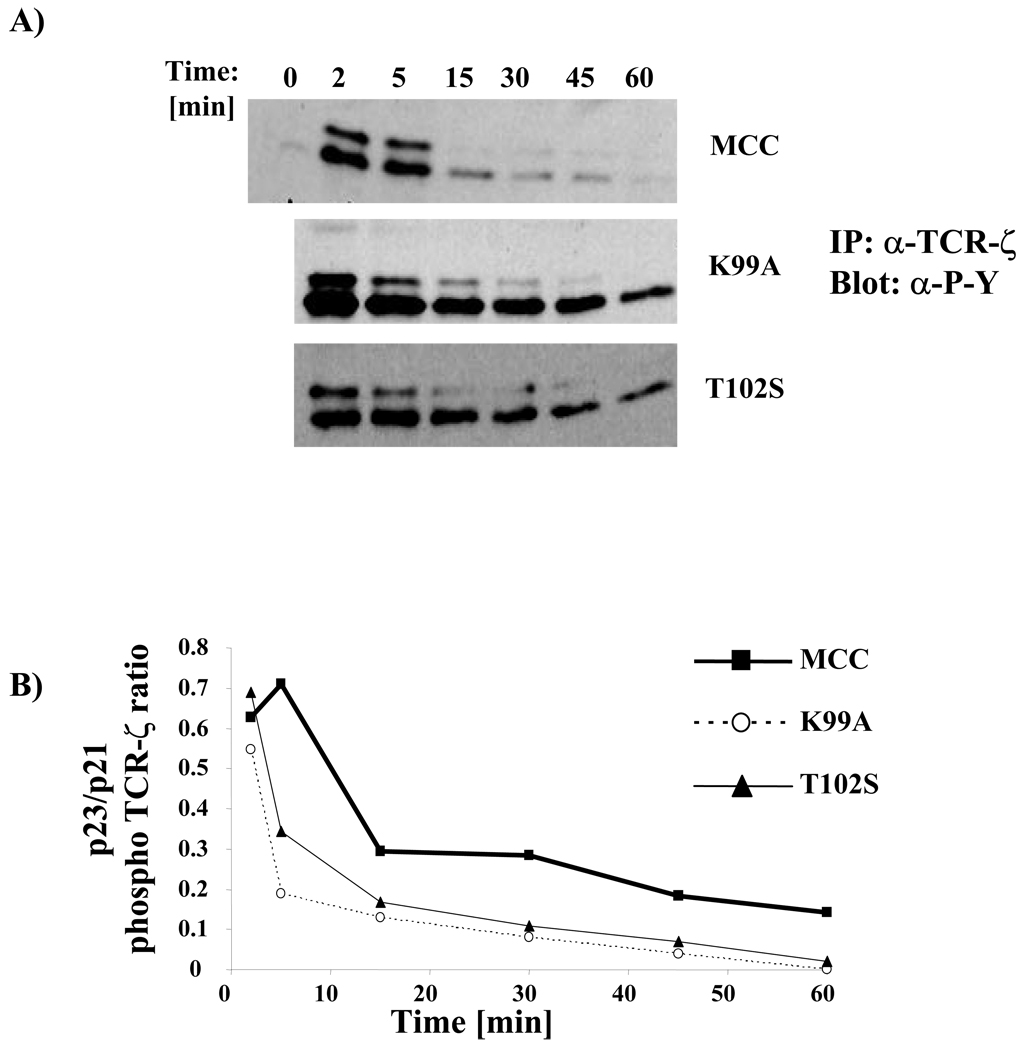
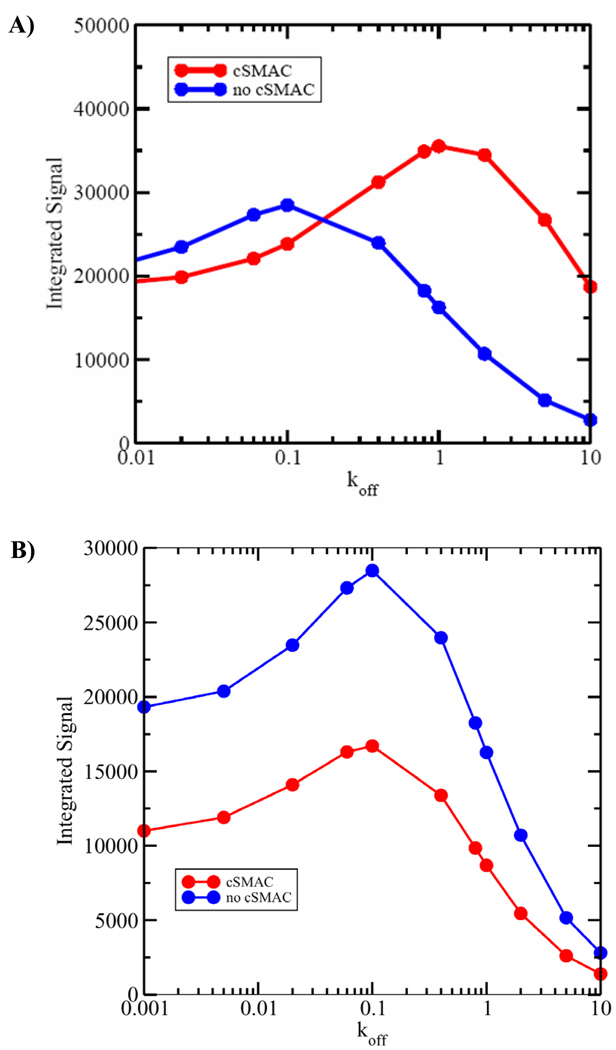
T cell activation is predicated on the interaction between the T cell receptor and peptide-major histocompatibility (pMHC) ligands. The factors that determine the stimulatory potency of a pMHC molecule remain unclear. We describe results showing that a peptide exhibiting many hallmarks of a weak agonist stimulates T cells to proliferate more than the wild-type agonist ligand. An in silico approach suggested that the inability to form the central supramolecular activation cluster (cSMAC) could underlie the increased proliferation. This conclusion was supported by experiments that showed that enhancing cSMAC formation reduced stimulatory capacity of the weak peptide. Our studies highlight the fact that a complex interplay of factors determines the quality of a T cell antigen.


Figures

Fig. 1
Fig. 1. Proliferative response of AND and 5C.C7 T cells to WT and altered MCC peptides
AND CD4+ T cells (A, B) and 5C.C7 CD4+ T cells (C) were isolated from spleens of TCR transgenic mice and stimulated with irradiated B10.BR splenocytes and the indicated peptides for 72 hours. The T cell proliferative response was assessed by the incorporation of [3H]-thymidine added for the last 18 hours of the stimulation. (n=10). C) AND T cells were CFSE labeled and stimulated for 3 days with irradiated B10.BR splenocytes loaded with 1 µM of the indicated peptides. The T cell proliferative response was assessed by CFSE dilution. (n=3).
Fig. 2
Fig. 2. Staining of AND cells with I–Ek tetramers presenting MCC and its APLs
Naïve CD4+ AND T cells were stained with the indicated tetramers for 3 hours at 10 degrees (in azide-containing buffer) and with anti-CD8-FITC and anti-B220-CyChrome during the last 30 minutes, washed 3 times in ice cold FACS buffer and immediately analyzed by flow cytometry (A) or resuspended in FACS buffer with 100 µg/ml of 14.4.4 antibody and incubated at 4°C. At indicated timepoints aliquots were taken and analyzed by flow cytometry for tetramer staining (B). Gate was set on FS/SS bright, CD8 negative and B220 negative cells. (n=3)
Fig. 3
Fig. 3. TCR downregulation and degradation in AND T cells stimulated with WTand APLs for MCC 88–103 peptide
A) CD4+ T cells were purified from AND TCR tg mice spleens and stimulated for 3 hours with CH27 cells loaded with increasing amounts of the indicated peptides. Upon stimulation, cell conjugates were disrupted by trypsin-EDTA treatment, cells were stained with anti-Vβ3 and anti-CD4 antibodies, washed and analyzed by flow cytometry for surface TCR expression. (n=7) B) Rested AND CD4+ T cells were pretreated for 45 minutes with cyclohexamide and subsequently stimulated for 3 hours with CH27 cells loaded with 30 µM of the indicated peptide. Upon stimulation, cells were lysed and TCR-ζ expression was assessed by western blotting. (n=3)
Fig. 4
Fig. 4. Conjugate and immunological synapses formation induced by WT, K99A and T102S MCC peptides
A) CD4+ AND T cells were labeled with CFSE and incubated for 30 minutes with peptide pulsed, Cell Trace-calcein labeled CH27 cells. Cells were then gently washed and conjugate formation assessed by flow cytometry. The percentage of T cells forming conjugates is presented as percentage of total T cells. (n=3) B-D) CD4+ AND T cells were retrovirally transduced with GFP-TCR-ζ, and sorted for GFP expression. T cells were incubated with CH27 cells pulsed with 30 µM of the indicated peptide. After 30 minutes, cells were fixed, mounted on poly-L-lysine treated slides and analyzed by confocal microscopy. Over 100 individual T cell-CH27 conjugates (n=3) were assessed for each tested peptide. Examples of how cell conjugates were scored for TCR-ζ accumulation at the contact site are shown in B. The percentages of T cells accumulating TCR-ζ at the contact site (C) and forming cSMACs (D) is presented as percentage of total conjugates analyzed.
Fig. 5
Fig. 5. Kinetics of TCR-ζ phosphorylation in AND cells upon stimulation with WT, K99A and T102S MCC
(A) Rested AND CD4+ Tells were stimulated with CH27 cells loaded with 10 µM of the indicated peptide for the indicated times. Upon stimulation cells were lysed, TCR-ζ was immunoprecipitated and tyrosine phosphorylation was assessed by immunoblotting. (n=4) (B) p23/p21 ratio after WT, K99A and T102S MCC stimulation over time. The data shown in (A) was analyzed using densitometry.
Fig. 6
Fig. 6. Dependence of integrated signal on antigen quality
(A) Results for the first hypothesis described in the text. Data for calculations are compared for two cases, one where a cSMAC (red circles) is allowed to form regardless of the value of koff and the other where no cSMAC (blue circles) is ever present. For small values of koff, cSMAC formation inhibited the total amount of integrated signal, while the opposite was true for ligands that bind TCR weakly. These calculations were carried out with a pMHC density of 1 molecule/(µm)2. Higher pMHC densities (e.g., 10 molecules/(µm)2) did not change the qualitative behavior (figure S19 ). These calculations were carried out for a value (Li et al., 2004) of kon equal to 2200 M−1 s−1. (B) Results for the second hypothesis described in the text. Integrated signal from a model (red line) where the cSMAC serves as a site for degradation only is compared with the situation where there is no cSMAC formation (blue line). All parameters are the same as in (A). The signal is always higher when there is no cSMAC formation and there is no intersection point as in Fig. 6A.
Fig. 7
Fig. 7. Coerced cSMAC formation inhibits the proliferative response of AND T cells to K99A
CD4+ AND T cells were retrovirally transduced with DAP10-YFP and NKG2D, and sorted for YFP and NKG2D expression. T cells were incubated, as indicated, with wt CH27 cells or CH27 cells transduced with Rae-1ε, unpulsed or pulsed with 20 µM of the indicated peptide. After 30 minutes, cells were fixed, mounted on poly-L-lysine treated slides and analyzed by confocal microscopy. Over 50 individual T cell-CH27 conjugates (n=2) were assessed. Examples of how cell conjugates were scored for DAP10-YFP accumulation at the contact site are shown in (A). The percentages of T cells accumulating DAP10 at the contact site (B) and forming cSMACs (C) are presented as the percentage of total conjugates analyzed. (D) NKG2D/DAP10-double positive AND T cells (dashed line) and wt AND T cells (full line) were stimulated with mitomycin C-treated, Rae-1e–expressing CH27 cells pulsed with 3µM or 0.1µM (data not shown) of the indicated peptide. The T cell proliferative responses were assessed by the incorporation of [3H]-thymidine added for the last 18 hours of the stimulation. (n=2).

Similar articles

Cited by

References

    1. Altan-Bonnet G, Germain RN. Modeling T cell antigen discrimination based on feedback control of digital ERK responses. PLoS Biol. 2005;3:e356. - PMC - PubMed
    1. Bachmann MF, Oxenius A, Speiser DE, Mariathasan S, Hengartner H, Zinkernagel RM, Ohashi PS. Peptide-induced T cell receptor down-regulation on naive T cells predicts agonist/partial agonist properties and strictly correlates with T cell activation. Eur J Immunol. 1997;27:2195–2203. - PubMed
    1. Berg LJ, Pullen AM, Fazekas de St Groth B, Mathis D, Benoist C, Davis MM. Antigen/MHC-specific T cells are preferentially exported from the thymus in the presence of their MHC ligand. Cell. 1989;58:1035–1046. - PubMed
    1. Campi G, Varma R, Dustin ML. Actin and agonist MHC-peptide complex-dependent T cell receptor microclusters as scaffolds for signaling. J Exp Med. 2005;202:1031–1036. - PMC - PubMed
    1. Costello PS, Gallagher M, Cantrell DA. Sustained and dynamic inositol lipid metabolism inside and outside the immunological synapse. Nat Immunol. 2002;3:1082–1089. - PubMed

Publication types

MeSH terms