

Susceptibility for homeostatic plasticity is down-regulated in parallel with maturation of the rat hippocampal synaptic circuitry
- PMID: 17347263
- PMCID: PMC2075179
- DOI: 10.1113/jphysiol.2007.130062
Susceptibility for homeostatic plasticity is down-regulated in parallel with maturation of the rat hippocampal synaptic circuitry
Abstract
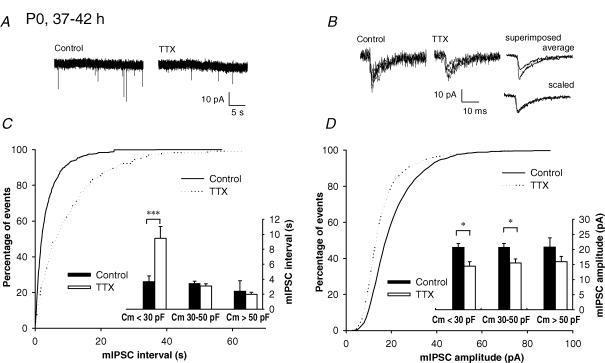
Homeostatic regulation, i.e. the ability of neurons and neuronal networks to adjust their output in response to chronic alterations in electrical activity is a prerequisite for the pronounced functional plasticity in the developing brain. Cellular mechanisms of homeostatic plasticity have mainly been studied in cultured preparations. To understand the developmental time frame and properties of homeostatic plasticity under more physiological conditions, we have here compared the effects of activity deprivation on synaptic transmission in acutely isolated and cultured hippocampal slices at different stages of development. We find that transmission at both glutamatergic and GABAergic synapses is strongly and rapidly (15 h) regulated in the opposite directions in response to inactivity during narrow, separated time windows early in development. Following this critical period of synaptic development, induction of the homeostatic response requires longer periods (40 h) of inactivity. At glutamatergic synapses, activity blockade led to an increase in the amplitude and frequency of mEPSCs, and the threshold for induction of this response was increased during development. In contrast, homeostatic regulation at GABAergic synapses was expressed in a qualitatively distinct manner at different developmental stages. Immature neurons responded rapidly to inactivity by regulating mIPSC frequency, while longer activity blockade led to a decrease in the mIPSC amplitude independent of the neuronal maturation. The susceptibility of immature networks to homeostatic regulation may serve as a safety mechanism against rapid runaway destability during the time of intense remodelling of the synaptic circuitry.
Figures


Similar articles
-
Homeostatic plasticity studied using in vivo hippocampal activity-blockade: synaptic scaling, intrinsic plasticity and age-dependence.PLoS One. 2007 Aug 8;2(8):e700. doi: 10.1371/journal.pone.0000700. PLoS One. 2007. PMID: 17684547 Free PMC article.
-
Age-dependent enhancement of inhibitory synaptic transmission in CA1 pyramidal neurons via GluR5 kainate receptors.Hippocampus. 2009 Aug;19(8):706-17. doi: 10.1002/hipo.20544. Hippocampus. 2009. PMID: 19123252
-
Age-dependent alterations of long-term synaptic plasticity in thyroid-deficient rats.Hippocampus. 2003;13(7):816-25. doi: 10.1002/hipo.10132. Hippocampus. 2003. PMID: 14620877
-
Cellular abnormalities and synaptic plasticity in seizure disorders of the immature nervous system.Ment Retard Dev Disabil Res Rev. 2000;6(4):258-67. doi: 10.1002/1098-2779(2000)6:4<258::AID-MRDD5>3.0.CO;2-H. Ment Retard Dev Disabil Res Rev. 2000. PMID: 11107191 Review.
-
Mechanisms of GABAergic homeostatic plasticity.Neural Plast. 2011;2011:489470. doi: 10.1155/2011/489470. Epub 2011 Aug 17. Neural Plast. 2011. PMID: 21876819 Free PMC article. Review.
Cited by
-
The Shaping of AMPA Receptor Surface Distribution by Neuronal Activity.Front Synaptic Neurosci. 2022 Mar 21;14:833782. doi: 10.3389/fnsyn.2022.833782. eCollection 2022. Front Synaptic Neurosci. 2022. PMID: 35387308 Free PMC article. Review.
-
Homeostatic synaptic plasticity: local and global mechanisms for stabilizing neuronal function.Cold Spring Harb Perspect Biol. 2012 Jan 1;4(1):a005736. doi: 10.1101/cshperspect.a005736. Cold Spring Harb Perspect Biol. 2012. PMID: 22086977 Free PMC article. Review.
-
GluA4 Dependent Plasticity Mechanisms Contribute to Developmental Synchronization of the CA3-CA1 Circuitry in the Hippocampus.Neurochem Res. 2019 Mar;44(3):562-571. doi: 10.1007/s11064-017-2392-8. Epub 2017 Aug 31. Neurochem Res. 2019. PMID: 28856535
-
Neonatal ketamine exposure impairs infrapyramidal bundle pruning and causes lasting increase in excitatory synaptic transmission in hippocampal CA3 neurons.Neurobiol Dis. 2022 Dec;175:105923. doi: 10.1016/j.nbd.2022.105923. Epub 2022 Nov 10. Neurobiol Dis. 2022. PMID: 36371060 Free PMC article.
-
Wherefore art thou, homeo(stasis)? Functional diversity in homeostatic synaptic plasticity.Neural Plast. 2012;2012:718203. doi: 10.1155/2012/718203. Epub 2012 May 17. Neural Plast. 2012. PMID: 22685679 Free PMC article. Review.
References
-
- Ben-Ari Y. Developing networks play a similar melody. Trends Neurosci. 2001;24:353–360. - PubMed
-
- Buckby LE, Jensen TP, Smith PJ, Empson RM. Network stability through homeostatic scaling of excitatory and inhibitory synapses following inactivity in CA3 of rat organotypic hippocampal slices cultures. Mol Cell Neurosci. 2006;31:805–816. - PubMed
-
- Burrone J, Murthy VN. Synaptic gain control and homeostasis. Curr Opin Neurobiol. 2003;13:560–567. - PubMed
-
- Burrone J, O'Byrne M, Murthy VN. Multiple forms of synaptic plasticity triggered by selective suppression of activity in individual neurons. Nature. 2002;420:414–418. - PubMed
Publication types
MeSH terms
Substances
LinkOut - more resources
Full Text Sources
Medical