

Theory of forward and reverse middle-ear transmission applied to otoacoustic emissions in infant and adult ears
- PMID: 17348521
- PMCID: PMC2440519
- DOI: 10.1121/1.2427128
Theory of forward and reverse middle-ear transmission applied to otoacoustic emissions in infant and adult ears
Abstract
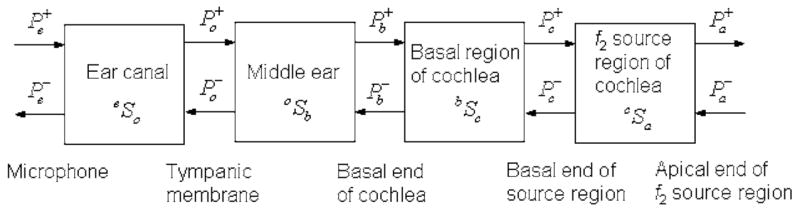
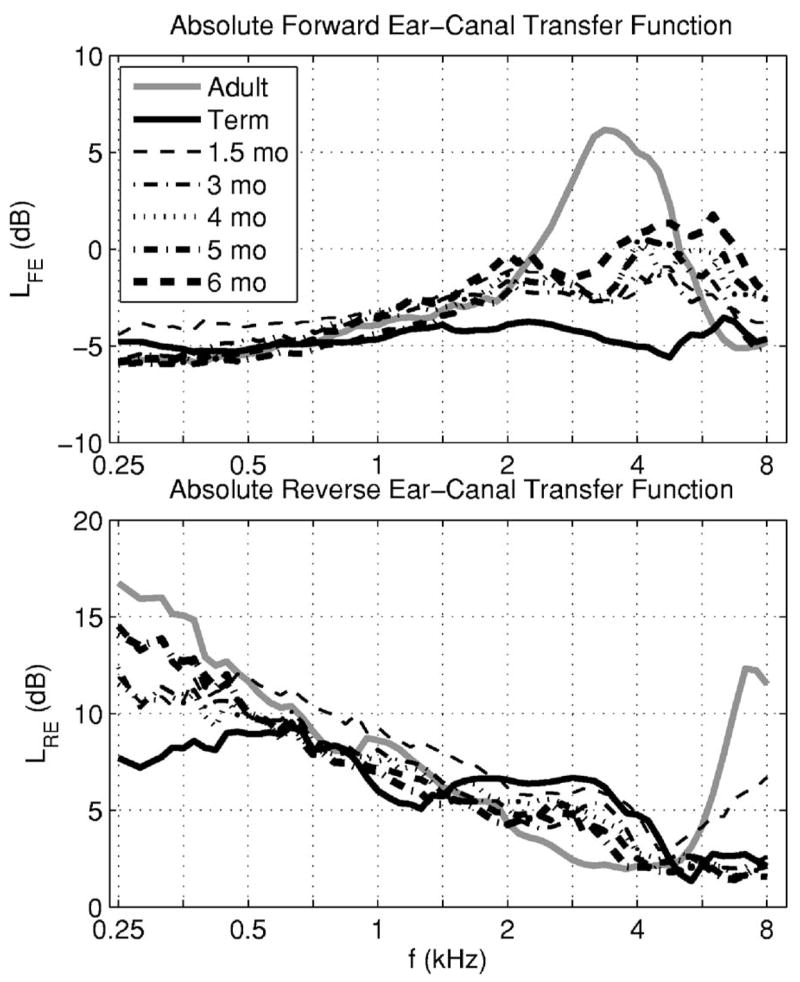
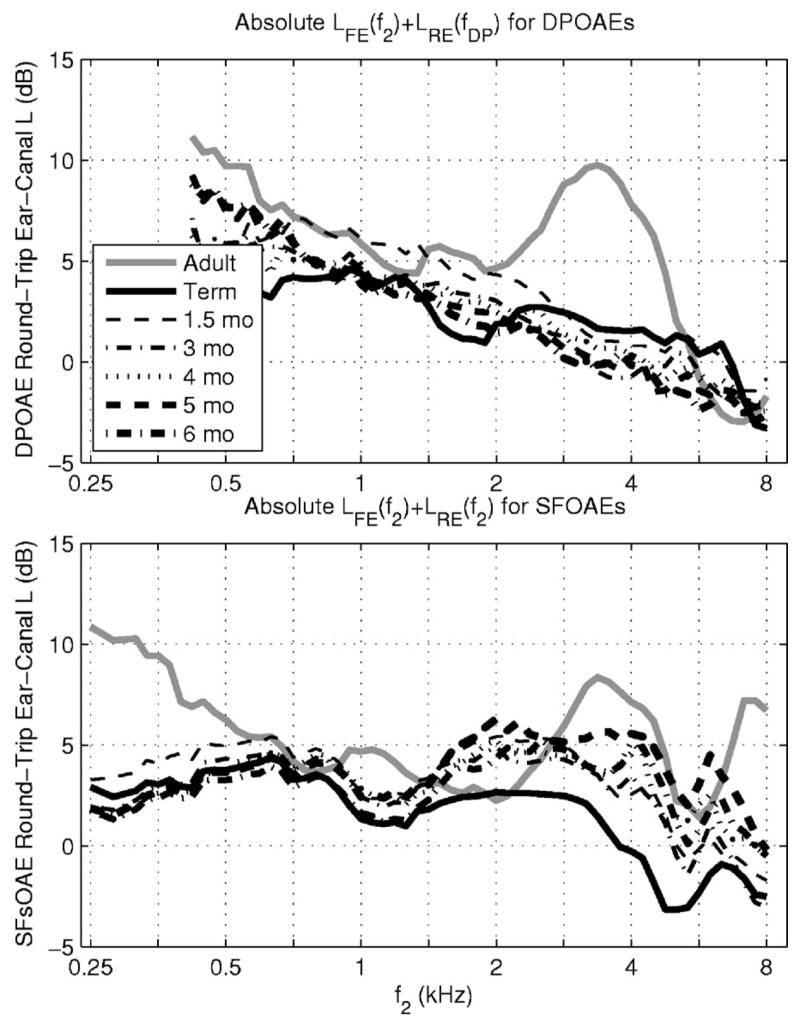
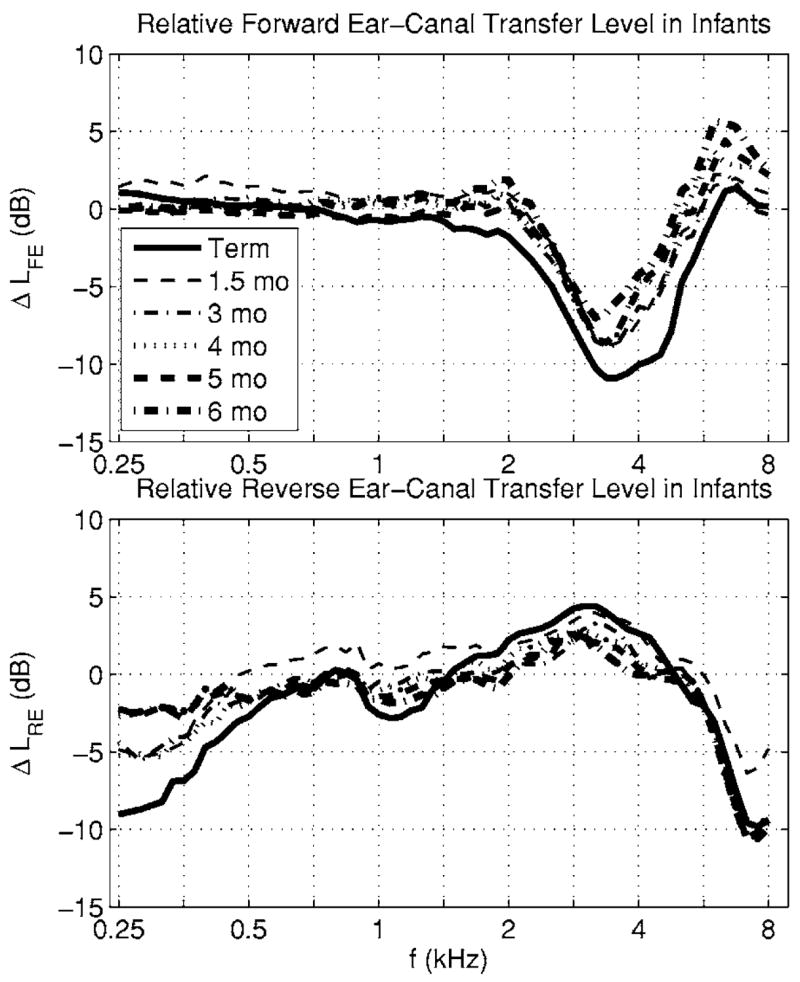
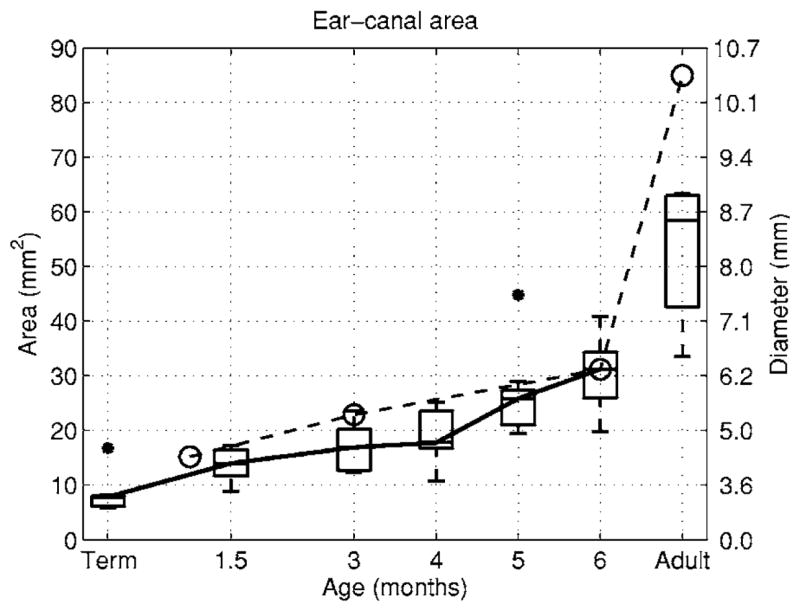
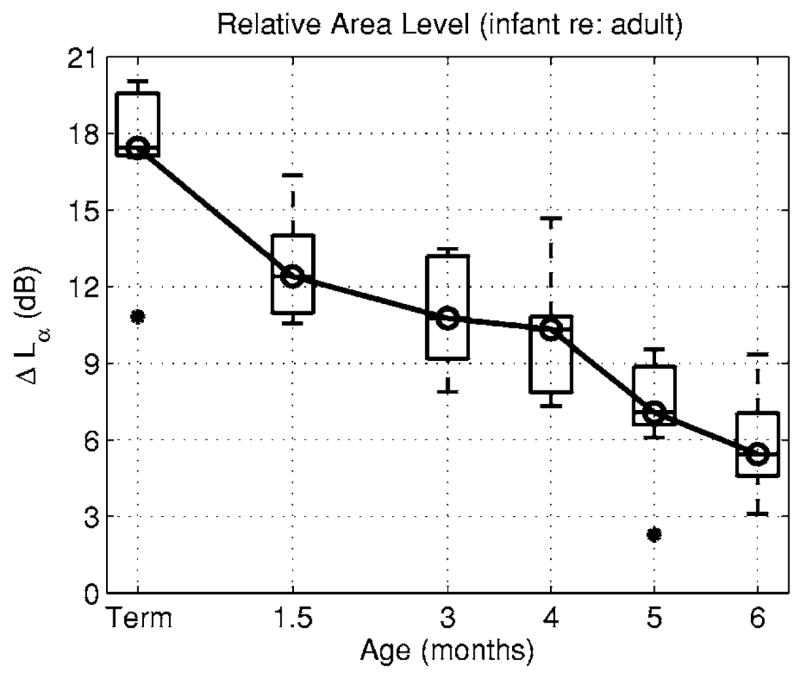
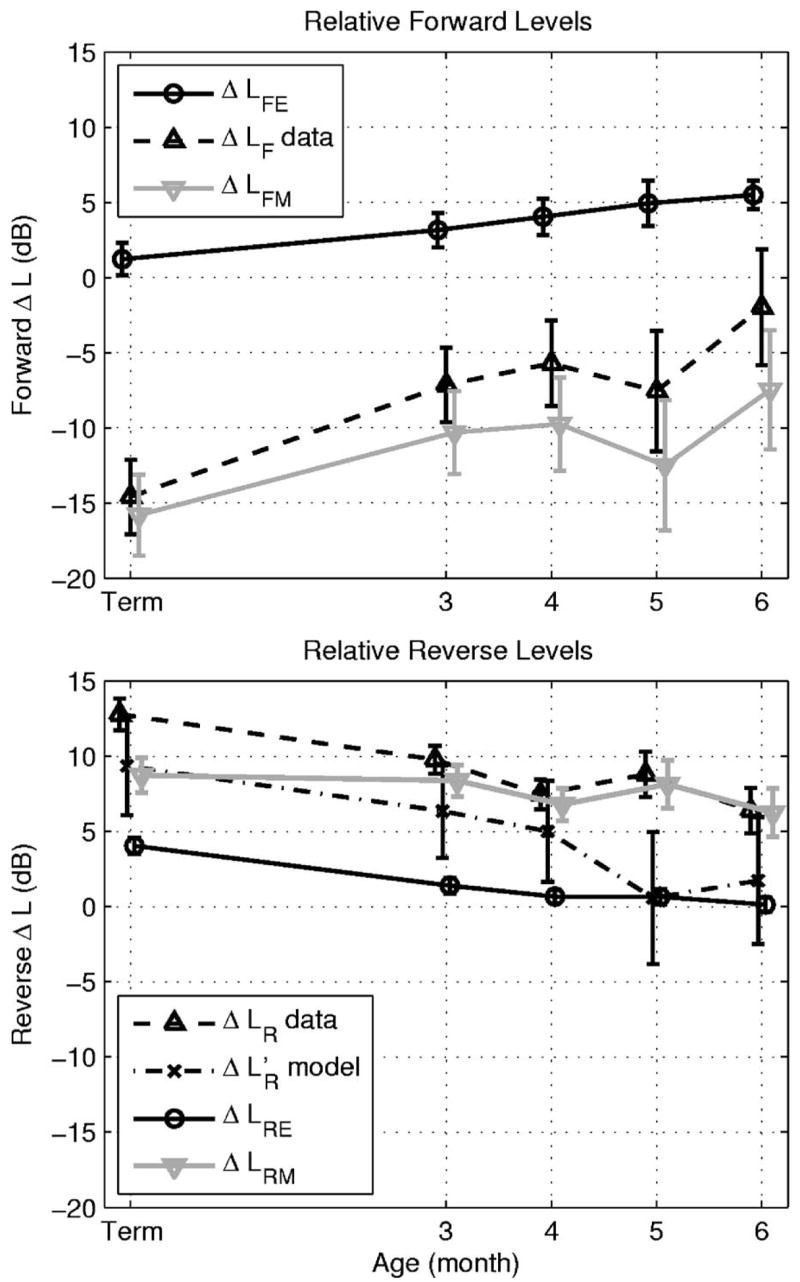
The purpose of this study is to understand why otoacoustic emission (OAE) levels are higher in normal-hearing human infants relative to adults. In a previous study, distortion product (DP) OAE input/output (I/O) functions were shown to differ at f2 = 6 kHz in adults compared to infants through 6 months of age. These DPOAE I/0 functions were used to noninvasively assess immaturities in forward/reverse transmission through the ear canal and middle ear [Abdala, C., and Keefe, D. H., (2006). J. Acoust Soc. Am. 120, 3832-3842]. In the present study, ear-canal reflectance and DPOAEs measured in the same ears were analyzed using a scattering-matrix model of forward and reverse transmission in the ear canal, middle ear, and cochlea. Reflectance measurements were sensitive to frequency-dependent effects of ear-canal and middle-ear transmission that differed across OAE type and subject age. Results indicated that DPOAE levels were larger in infants mainly because the reverse middle-ear transmittance level varied with ear-canal area, which differed by more than a factor of 7 between term infants and adults. The forward middle-ear transmittance level was -16 dB less in infants, so that the conductive efficiency was poorer in infants than adults.
Figures
Comment on
-
Effects of middle-ear immaturity on distortion product otoacoustic emission suppression tuning in infant ears.J Acoust Soc Am. 2006 Dec;120(6):3832-42. doi: 10.1121/1.2359237. J Acoust Soc Am. 2006. PMID: 17225410
Similar articles
-
Ear canal pressure variations versus negative middle ear pressure: comparison using distortion product otoacoustic emission measurement in humans.Ear Hear. 2012 Jan-Feb;33(1):69-78. doi: 10.1097/AUD.0b013e3182280326. Ear Hear. 2012. PMID: 21747284
-
Distortion-product otoacoustic-emission suppression tuning in human infants and adults using absorbed sound power.J Acoust Soc Am. 2011 Apr;129(4):EL108-13. doi: 10.1121/1.3553389. J Acoust Soc Am. 2011. PMID: 21476616 Free PMC article.
-
Effects of middle-ear immaturity on distortion product otoacoustic emission suppression tuning in infant ears.J Acoust Soc Am. 2006 Dec;120(6):3832-42. doi: 10.1121/1.2359237. J Acoust Soc Am. 2006. PMID: 17225410
-
A comparative study of distortion-product-otoacoustic-emission fine structure in human newborns and adults with normal hearing.J Acoust Soc Am. 2007 Oct;122(4):2191-202. doi: 10.1121/1.2770544. J Acoust Soc Am. 2007. PMID: 17902855
-
Simultaneous measurement of middle-ear input impedance and forward/reverse transmission in cat.J Acoust Soc Am. 2004 Oct;116(4 Pt 1):2187-98. doi: 10.1121/1.1785832. J Acoust Soc Am. 2004. PMID: 15532651
Cited by
-
Human middle-ear model with compound eardrum and airway branching in mastoid air cells.J Acoust Soc Am. 2015 May;137(5):2698-725. doi: 10.1121/1.4916592. J Acoust Soc Am. 2015. PMID: 25994701 Free PMC article.
-
Do "optimal" conditions improve distortion product otoacoustic emission test performance?Ear Hear. 2011 Mar-Apr;32(2):230-7. doi: 10.1097/AUD.0b013e3181fa5da2. Ear Hear. 2011. PMID: 21057318 Free PMC article.
-
Forward and Reverse Middle Ear Transmission in Gerbil with a Normal or Spontaneously Healed Tympanic Membrane.J Assoc Res Otolaryngol. 2021 Jun;22(3):261-274. doi: 10.1007/s10162-020-00779-8. Epub 2021 Feb 16. J Assoc Res Otolaryngol. 2021. PMID: 33591494 Free PMC article.
-
Effects of maturation on tympanometric wideband acoustic transfer functions in human infants.J Acoust Soc Am. 2008 Oct;124(4):2106-22. doi: 10.1121/1.2967864. J Acoust Soc Am. 2008. PMID: 19062852 Free PMC article.
-
Effect of age on click-evoked otoacoustic emission: A systematic review.Neural Regen Res. 2012 Apr 15;7(11):853-61. doi: 10.3969/j.issn.1673-5374.2012.11.010. Neural Regen Res. 2012. PMID: 25737714 Free PMC article.
References
-
- Abdala C, Keefe DH. Effects of middle-ear immaturity on distortion-product otoacoustic emission suppression tuning in infant ears. J Acoust Soc Am. 2006;120:3832–3842. - PubMed
-
- Burns EM, Keefe DH. Energy reflectance can exceed unity near SOAE frequencies. J Acoust Soc Am. 1998;103:462–474. - PubMed
-
- Efron B, Tibshirani R. Bootstrap methods for standard errors, confidence intervals, and other measurements of statistical accuracy. Stat Sci. 1986;1:54–77.
-
- Gorga MP, Neely ST, Bergman BM, Beauchaine KL, Kaminski JR, Peters J, Schulte L, Jesteadt W. A comparison of transient-evoked and distortion product otoacoustic emissions in normal-hearing and hearing-impaired subjects. J Acoust Soc Am. 1993;94:2639–2648. - PubMed
Publication types
MeSH terms
Grants and funding
LinkOut - more resources
Full Text Sources
Medical
Miscellaneous