Comment
. 2007 Feb;121(2):1056-69.
doi: 10.1121/1.2404625.

The binaural performance of a cross-talk cancellation system with matched or mismatched setup and playback acoustics

Affiliations
Comment

The binaural performance of a cross-talk cancellation system with matched or mismatched setup and playback acoustics

Michael A Akeroyd et al. J Acoust Soc Am. 2007 Feb.

Abstract

Cross-talk cancellation is a method for synthesizing virtual auditory space using loudspeakers. One implementation is the "Optimal Source Distribution" technique [T. Takeuchi and P. Nelson, J. Acoust. Soc. Am. 112, 2786-2797 (2002)], in which the audio bandwidth is split across three pairs of loudspeakers, placed at azimuths of +/-90 degrees, +/-15 degrees, and +/-3 degrees, conveying low, mid, and high frequencies, respectively. A computational simulation of this system was developed and verified against measurements made on an acoustic system using a manikin. Both the acoustic system and the simulation gave a wideband average cancellation of almost 25 dB. The simulation showed that when there was a mismatch between the head-related transfer functions used to set up the system and those of the final listener, the cancellation was reduced to an average of 13 dB. Moreover, in this case the binaural interaural time differences and interaural level differences delivered by the simulation of the optimal source distribution (OSD) system often differed from the target values. It is concluded that only when the OSD system is set up with "matched" head-related transfer functions can it deliver accurate binaural cues.


Figures

FIGURE 1
FIGURE 1
Scale diagram of the six-loudspeaker, ±3°/±15°/±90° OSD system. The ±3° loudspeakers were used for frequencies above 3500 Hz, the ±15° loudspeakers between 500 and 3500 Hz, and the ±90°-loudspeakers below 500 Hz.
FIGURE 2
FIGURE 2
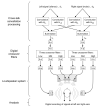
Schematic illustration of each step involved in the acoustic cross-talk cancellation system. The first step (the cross-talk cancellation processing) was performed on a personal computer while the second step (cross-over filters) was performed on a separate digital-signal processing board; note the D/A and A/D converters between them. The final step was the loudspeaker presentation of the signals to an acoustic manikin, acting as the listener, with a subsequent off-line analysis of the actual signals received at its ears.
FIGURE 3
FIGURE 3
The left-loudspeaker-to-left-microphone (“CLL”) impulse response, measured using the MLS method in the ±3°/±15°/±90° cross-talk cancellation system. The direct sound is marked, along with two putative reflections, which were removed in subsequent modifications.
FIGURE 4
FIGURE 4
The top panel shows the magnitude spectra of the signals delivered to the microphones of the manikin by the ±3°/±15°/±90° cross-talk cancellation system. The right-ear target was a 0-8 kHz white noise, while the left ear target was silence. The bottom panel shows the amount of cross-talk cancellation achieved, which was defined as the difference in those magnitude spectra.
FIGURE 5
FIGURE 5
A scale diagram of the modified acoustic system, using two-loudspeakers at ±9° (c.f. Fig. 1), and the amount of cross-talk cancellation it gave (c.f. Fig. 4).
FIGURE 6
FIGURE 6
Schematic illustration of each step involved in the computational simulations of cross-talk cancellation. The steps follow the acoustic system (Fig. 2), except that the loudspeaker presentation is simulated by a set of digital convolution and summations. The illustration represents simulations C, D, and E (Table I), as the digital cross-over filters are not shown; simulations A and B included them.
FIGURE 7
FIGURE 7
The results of the five computational simulations of cross-talk cancellation. The parameters of each simulation are reported in Table I. The bold lines in each panel show the amount of cross-talk cancellation predicted by the simulations, and the faint lines show the corresponding acoustical measurements.
FIGURE 8
FIGURE 8
The magnitude spectra of the signals at the microphones of the manikin calculated from the computational simulation. The top panel shows the results for a matched-HRIR system, the bottom panel for a mismatched-HRIR system.
FIGURE 9
FIGURE 9
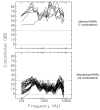
The amounts of cross-talk cancellation calculated from the computational simulation, for each of the 7 matched-HRIR systems (top panel) and each of the 42 mismatched-HRIR systems (bottom panel). The values of wideband cancellation for each system are reported in Table II.
FIGURE 10
FIGURE 10
The binaural performance of the computational simulation of cross-talk cancellation, calculated for a matched-HRIR system (left panel) and two mismatched-HRIR systems (middle & right panels). Each panel shows the ongoing ITD (ordinate) and ILD (abscissa) delivered by the simulation for a large set of combinations of target ITD and ILDs (parameters); the lines join points with the same target ILD. The analysis was run at an auditory-filter frequency of 1000 Hz.
FIGURE 11
FIGURE 11
The results of the ongoing-ITD and ongoing-ILD analyses of the computational simulation as a function of auditory-filter frequency. Each point plots the mean across all 42 mismatched-HRIR systems (the error bars show the standard deviations). For the top-left & bottom-left panels, the target ITD/ILD was −500-μs/0-dB; for the top-right & bottom-right panels, the target were +500-μs/0-dB. The few mismatched-HRIR systems that gave exceptional ITDs (taken as being on the wrong side) are plotted as open circles.
FIGURE 12
FIGURE 12
The binaural performance of the computational simulations, for the envelope ITD and ILD at 1000 Hz. The format is the same as Fig. 10.
FIGURE 13
FIGURE 13
The results of the envelope-ITD and envelope-ILD analyses of the computational simulation as a function of auditory-filter frequency. Each point plots the mean across all 42 mismatched-HRIR systems (the error bars show the standard deviations). The six panels are for target ITD/ILDs of +500-μs/0-dB (top-left & bottom-left), +500-μs/10-dB (top-middle /& bottom-middle), and +500-μs/20-dB target (top-right & bottom-right).

Comment on

Similar articles

Cited by

References

    1. Akeroyd MA. [last viewed November 6, 2006];A binaural cross-correlogram toolbox for MATLAB. 2001 software downloadable from http://www.ihr.gla.ac.uk/products/matlab.php.
    1. Akeroyd MA, Summerfield Q. The lateralization of simple dichotic pitches. J. Acoust. Soc. Am. 2000;108:316–334. - PubMed
    1. Algazi VR, Duda RO, Thompson DM. The CIPIC HRTF database. Proceedings of the 2001 IEEE Workshop on Applications of Signal Processing to Audio and Electronics; New Paltz, New York: 2001. pp. 99–102.
    1. Atal BS, Schroeder MR. US Patent #3236949. Apparent Sound Source Translator. 1962 [reviewed in J. Acoust. Soc. Am. 41, 263-264 (1967)]
    1. Bai MR, Tung CW, Lee CC. Optimal design of loudspeaker arrays for robust cross-talk cancellation using the Taguchi method and the genetic algorithm. J. Acoust. Soc. Am. 2005;117:2802–2813. - PubMed

Publication types