. 2007 Feb;121(2):1077-89.
doi: 10.1121/1.2404927.

The detection of differences in the cues to distance by elderly hearing-impaired listeners

Affiliations

The detection of differences in the cues to distance by elderly hearing-impaired listeners

Michael A Akeroyd et al. J Acoust Soc Am. 2007 Feb.

Abstract

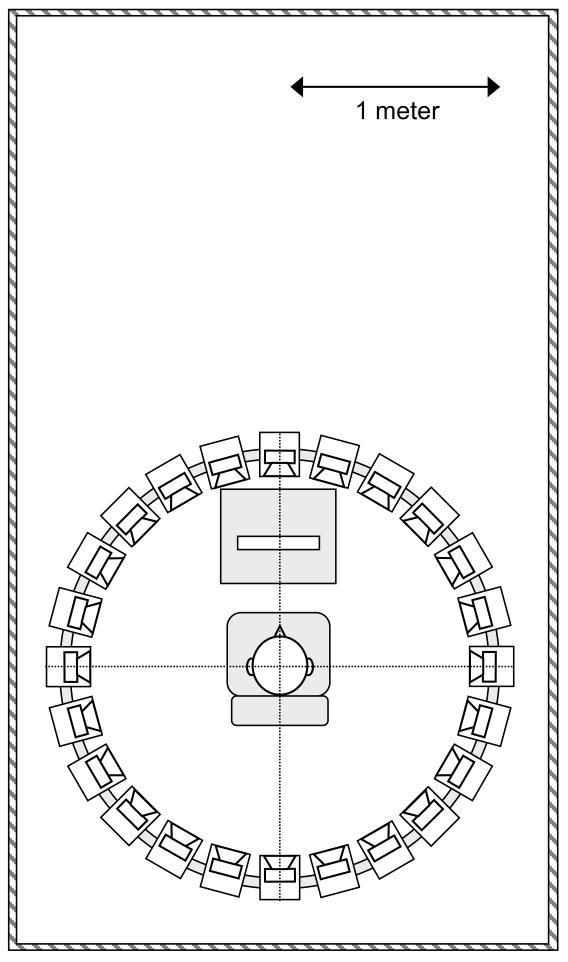
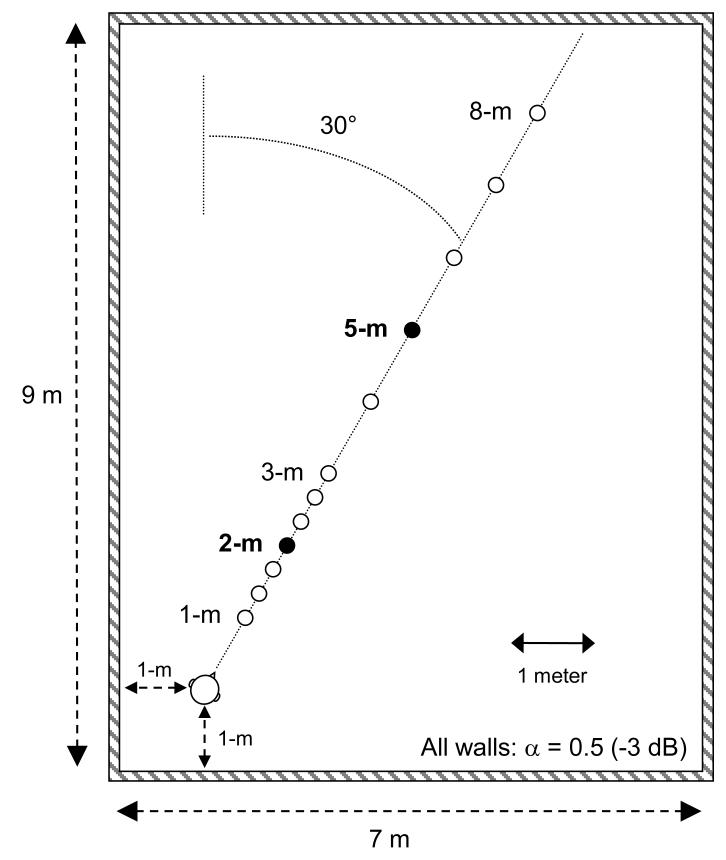
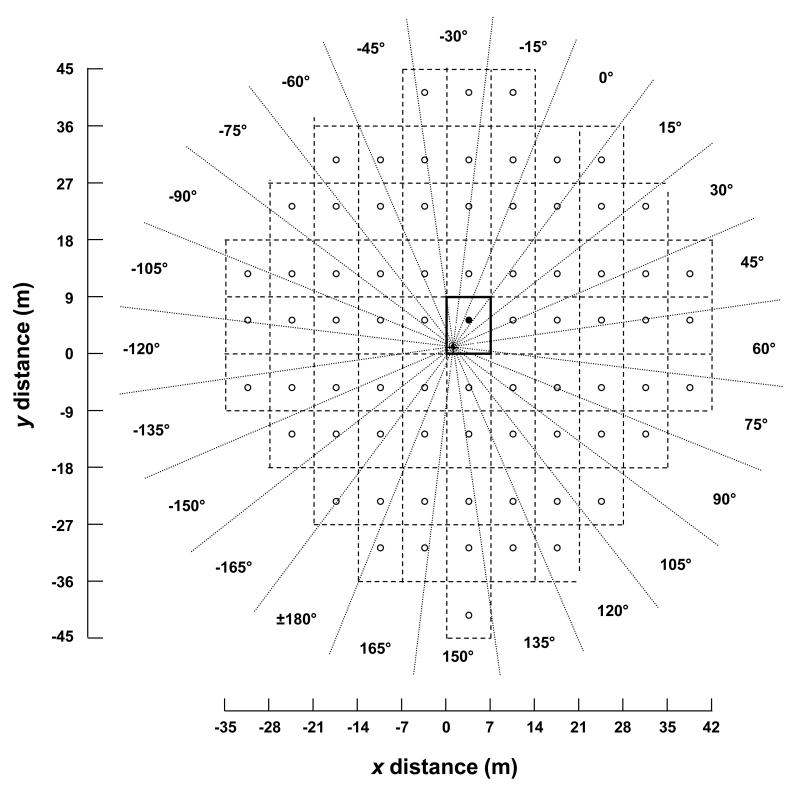
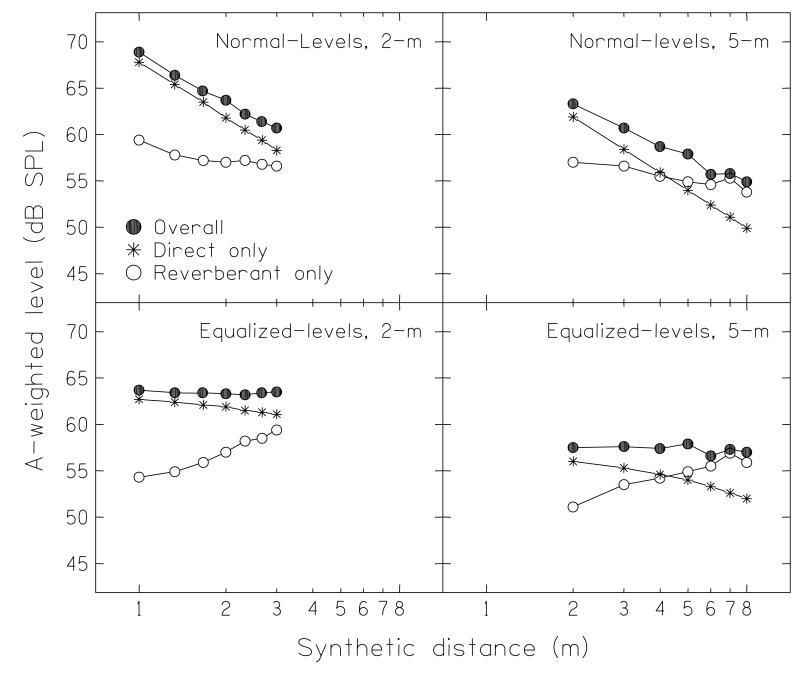
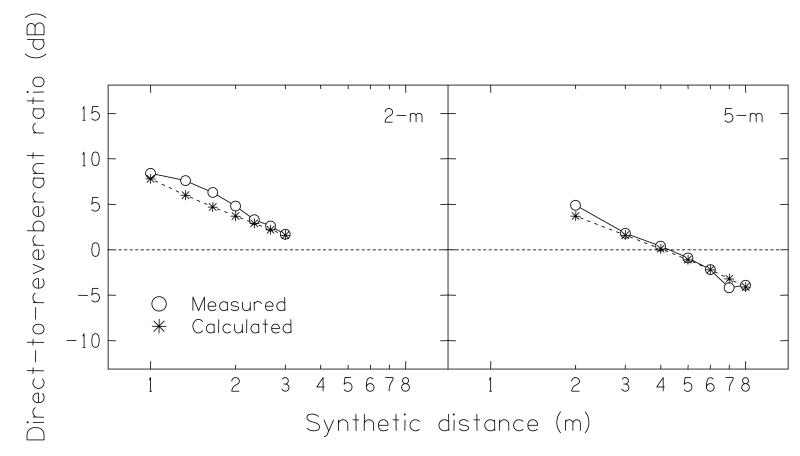
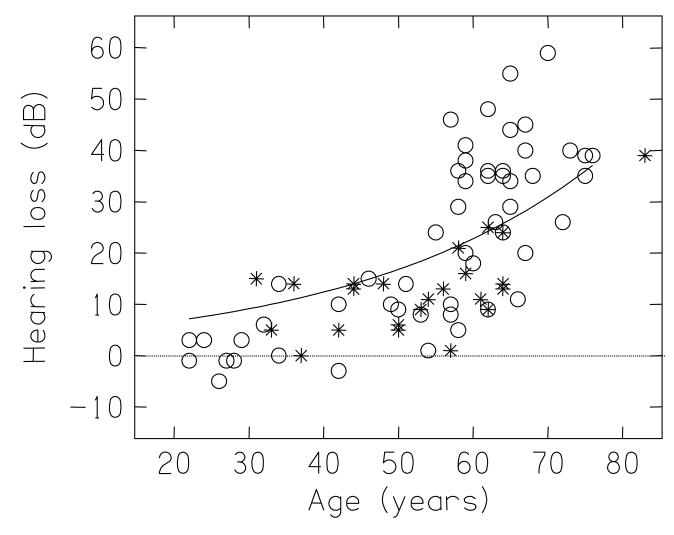
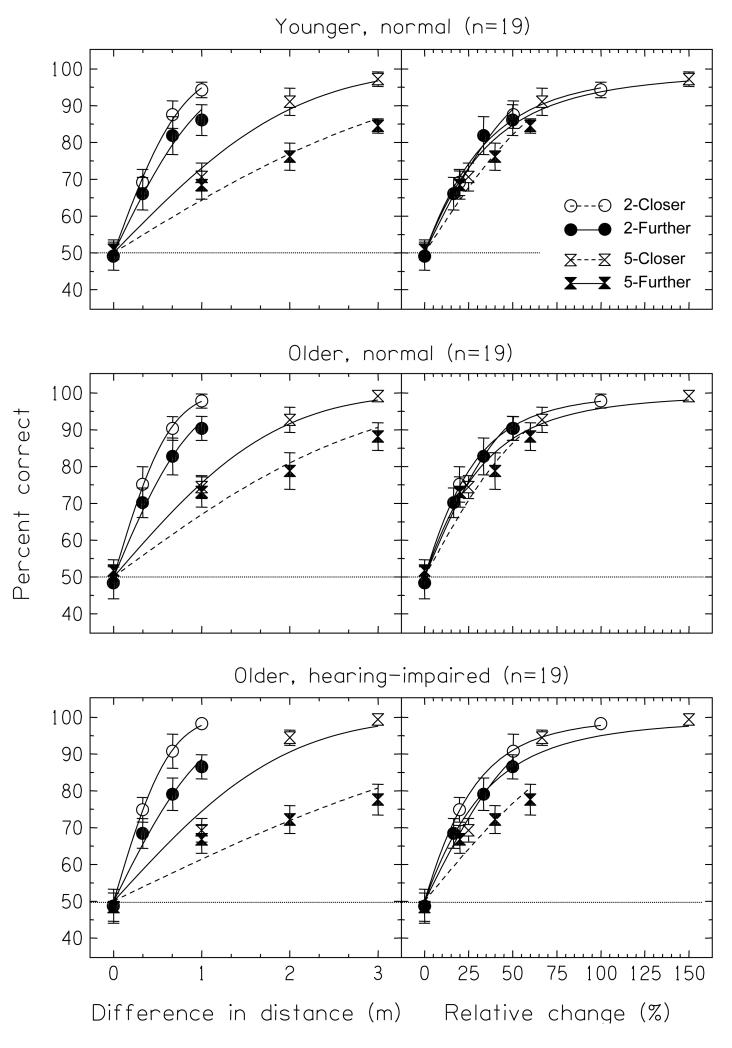
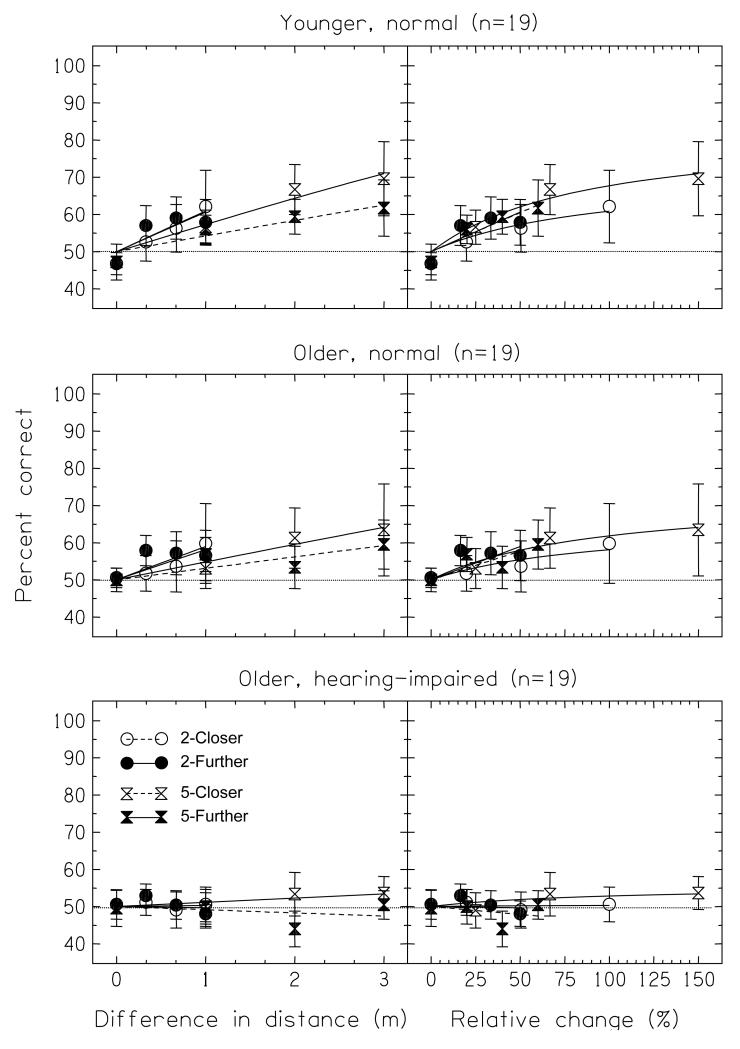
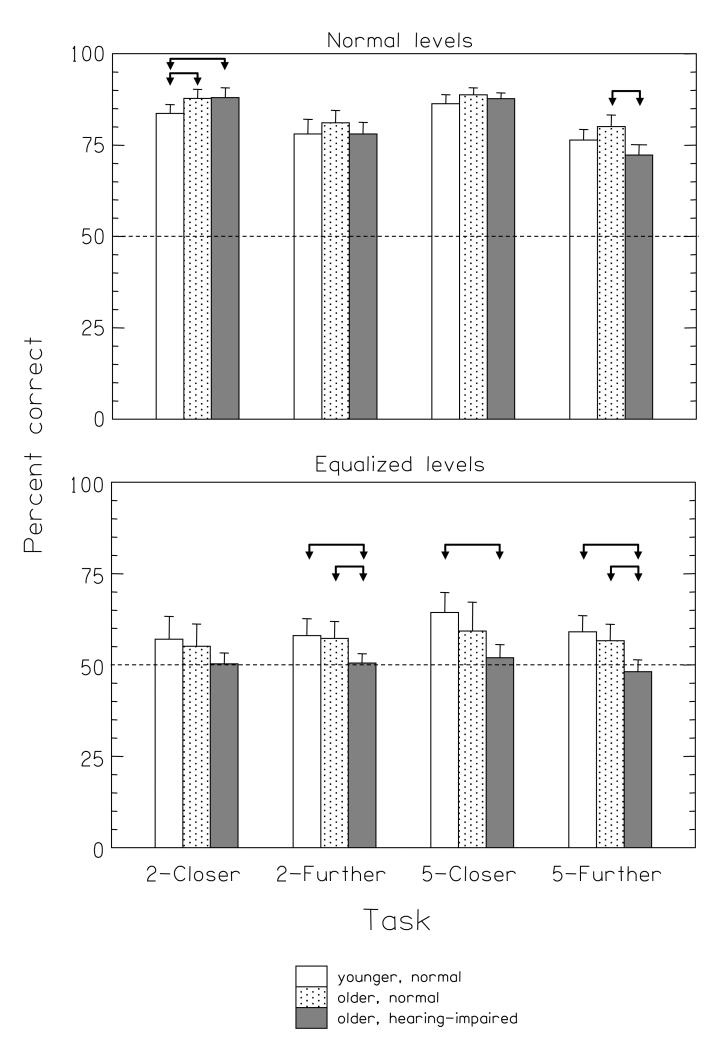
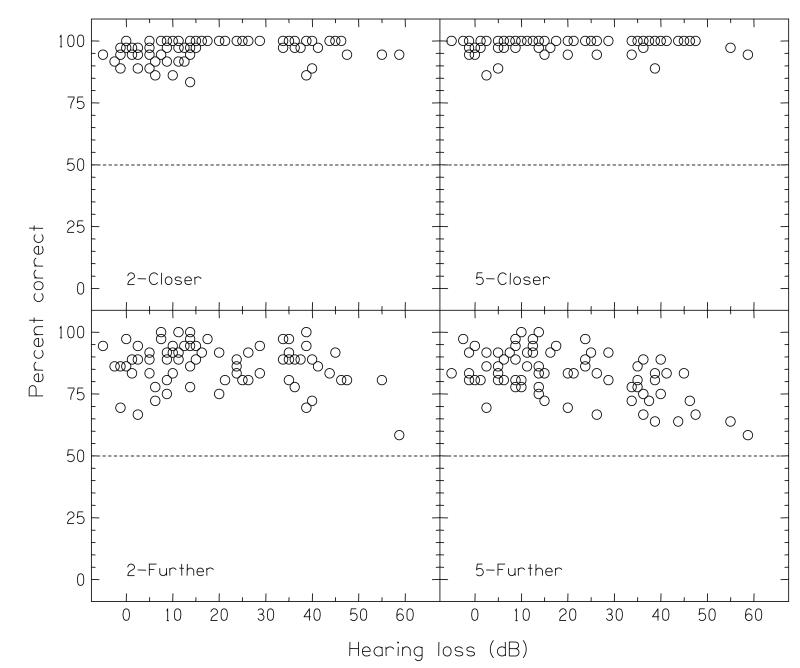
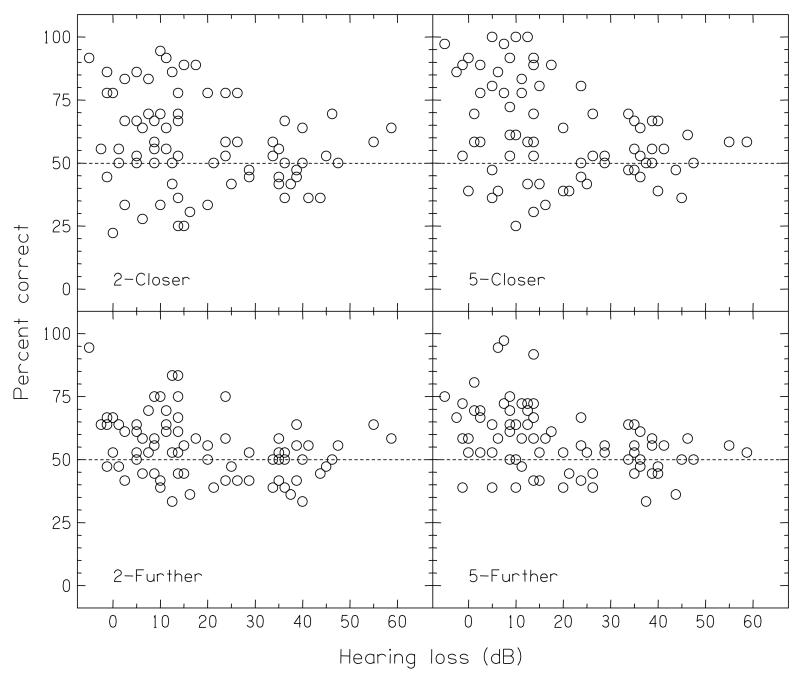
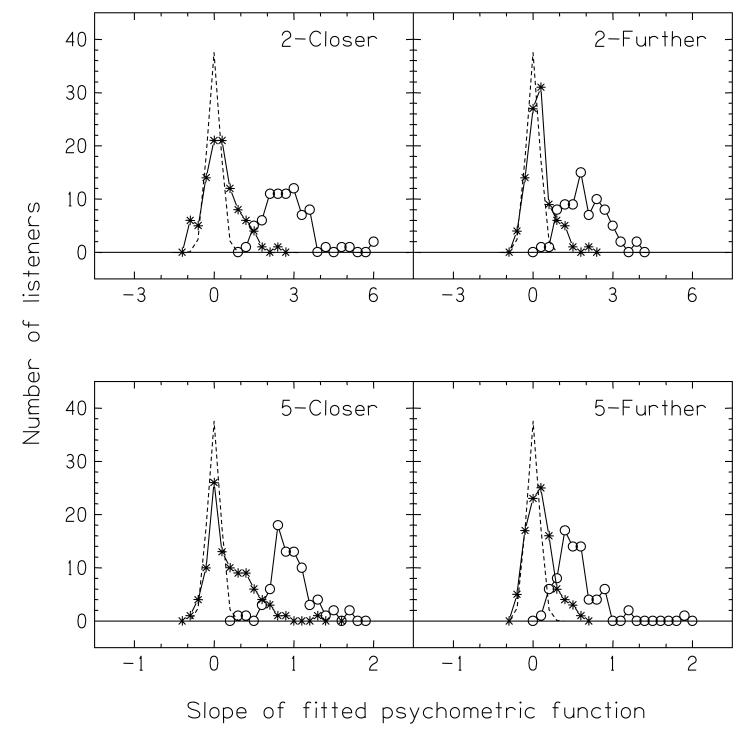
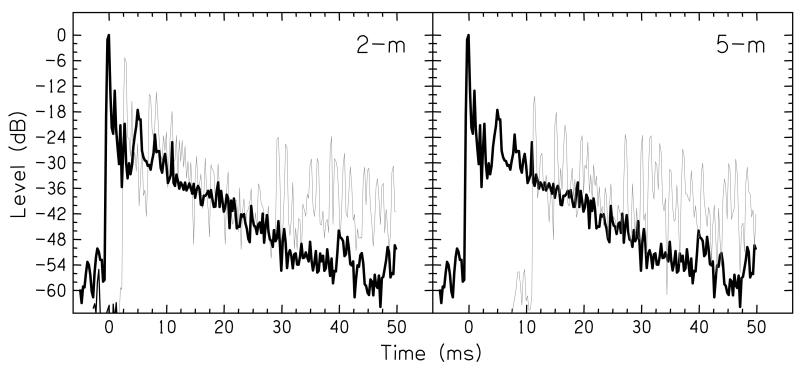
This experiment measured the capability of hearing-impaired individuals to discriminate differences in the cues to the distance of spoken sentences. The stimuli were generated synthetically, using a room-image procedure to calculate the direct sound and first 74 reflections for a source placed in a 7 x 9 m room, and then presenting each of those sounds individually through a circular array of 24 loudspeakers. Seventy-seven listeners participated, aged 22-83 years and with hearing levels from -5 to 59 dB HL. In conditions where a substantial change in overall level due to the inverse-square law was available as a cue, the elderly hearing-impaired listeners did not perform any different from control groups. In other conditions where that cue was unavailable (so leaving the direct-to-reverberant relationship as a cue), either because the reverberant field dominated the direct sound or because the overall level had been artificially equalized, hearing-impaired listeners performed worse than controls. There were significant correlations with listeners' self-reported distance capabilities as measured by the "Speech, Spatial, and Qualities of Hearing" questionnaire [S. Gatehouse and W. Noble, Int. J. Audiol. 43, 85-99 (2004)]. The results demonstrate that hearing-impaired listeners show deficits in the ability to use some of the cues which signal auditory distance.


Figures

FIGURE 1
FIGURE 1
Plan of the experimental room, showing the array of speakers, the response box, the chair, and a listener.
FIGURE 2
FIGURE 2
Plan of the virtual room, showing the position of each of the virtual sources and the listener’s head.
FIGURE 3
FIGURE 3
Schematic illustration of the image method for calculating the echoes. The original virtual room is shown by the solid rectangle together with the receiver (cross) and source (filled circle). Each of the image rooms are shown by the dashed rectangles, with the image source in each shown by the open circles. The angles are quantized to 15°-intervals (dashed lines) for presentation over the array. The x- and y-axes mark the scale, in meters.
FIGURE 4
FIGURE 4
The measured levels produced at the center of the array, for each of the virtual sources, as a function of the virtual distances. The asterisks mark the level of the direct sound, the open circles the level of all the other (reverberant) sounds, and the filled circles the combined level. The four panels are for the reference distance (2 or 5 m) crossed by the condition (normal- or equalized-level).
FIGURE 5
FIGURE 5
The direct-to-reverberant ratios for each of the virtual sources. The circles are derived from the measured levels reported in Fig. 4; the asterisks are computed directly from the results of the image-source method. The dashed line marks a direct-to-reverberant ratio of 0 dB.
FIGURE 6
FIGURE 6
The mean hearing loss in their better ear of the 77 listeners who took part in the experiment, plotted as a function of their age. The values are the average of 500, 1000, 2000, and 4000 Hz. The open circles are those listeners who completed a SSQ questionnaire; the asterisks are those who did not. The solid line plots the mean hearing loss from of the UK National Study of Hearing (Davies, 1995).
FIGURE 7
FIGURE 7
Average psychometric functions for the Normal-level conditions from each of the three groups of listeners (young normal, older normal, and older hearing-impaired). The four functions in each panel are for the four tasks of “2-Closer”, “2-Further”, “5-Closer”, and “5-Further”. In the left column the data is plotted as a function of the difference in distance between the two trials, Δr; in the right column the same data is plotted as a function of the percentage change in distance, Δr/rmin. The lines show psychometric functions fitted to the group data, assuming that was proportional to Δr; the 5-Further psychometric functions are shown by dashed lines to differentiate them from the others. Chance performance is 50%.
FIGURE 8
FIGURE 8
As Fig. 7 but for the Equalized-level conditions.
FIGURE 9
FIGURE 9
Top panel: Average discrimination thresholds for each of the three groups of listeners for the four tasks in the normal-level conditions. The error bars are the 95% confidence intervals. The discrimination thresholds were calculated for d′ = 1. Bottom panel: Average percent-correct for each of the three groups of listeners for the four tasks in the equalized-level conditions and in the normal-level conditions. The values are the averages of the 3 right-most points in each psychometric function plotted in Figs. 7 and 8. The error bars are the 95% confidence intervals. Chance performance is 50%. In both panels the arrows mark the significant comparisons reported in the main text.
FIGURE 10
FIGURE 10
Individual scores in the best (rightmost point) in each of the psychometric functions, plotted as a function of that individual’s hearing loss for the normal-level conditions.
FIGURE 11
FIGURE 11
As Fig. 10, but the individual scores for the equalized-level conditions.
FIGURE 12
FIGURE 12
Top left panel: Distribution of the slopes of the individual psychometric functions for the 2-m Closer task in the Normal-level condition (open circles) and in the Equalized-level conditions (asterisks). The dashed line plots the expected distribution given chance performance, found using a computer simulation. Other panels: corresponding results for the other conditions of the experiment. Note that the abscissa for the bottom panels is different from the abscissa for the top panels.
FIGURE 13
FIGURE 13
The instantaneous level of the impulse response of the loudspeakers in the array, recorded in three conditions: 2-m virtual source (left panel, gray line); 5-m virtual source (right-panel, gray line), and a real source at 1-m (both panels, solid line). The recordings have been bandpass filtered between 200 and 12000 Hz to avoid the background noise in the room, and are the result of time-aligning the responses to 10 individual clicks and then averaging.

Similar articles

Cited by

References

    1. Akeroyd MA, Chambers J, Bullock D, Palmer AR, Summerfield Q, Nelson PA, Gatehouse S. The binaural performance of a cross-talk cancellation system with matched or mismatched setup and playback acoustics. J. Acoust. Soc. Am. 2007 (in press; accepted Nov 8, 2006) - PMC - PubMed
    1. Allen JB, Berkley DA. Image method for efficiently simulating small-room acoustics. J. Acoust. Soc. Am. 1979;65:943–950.
    1. Ashmead DH, Davis DL, Northington A. Contribution of listeners’ approaching motion to auditory distance perception. J. Exp. Psychol. Hum. Percept. Perform. 1995;21:239–256. - PubMed
    1. Ashmead DH, LeRoy D, Odom RD. Perception of the relative distances of nearby sound sources. Percept. Psychophys. 1990;47:326–331. - PubMed
    1. Bench J, Bamford J. Speech-hearing tests and the spoken language of hearing impaired children. Academic Press; London: 1979.

Publication types