. 2007 Mar 9:8:85.
doi: 10.1186/1471-2105-8-85.

Model based analysis of real-time PCR data from DNA binding dye protocols

Affiliations

Model based analysis of real-time PCR data from DNA binding dye protocols

Mariano J Alvarez et al. BMC Bioinformatics. .

Abstract

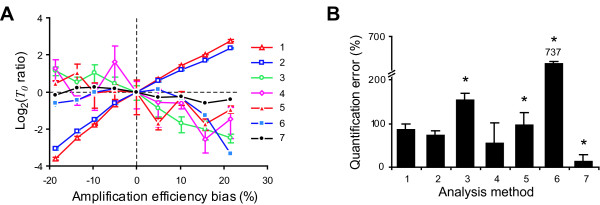
Background: Reverse transcription followed by real-time PCR is widely used for quantification of specific mRNA, and with the use of double-stranded DNA binding dyes it is becoming a standard for microarray data validation. Despite the kinetic information generated by real-time PCR, most popular analysis methods assume constant amplification efficiency among samples, introducing strong biases when amplification efficiencies are not the same.

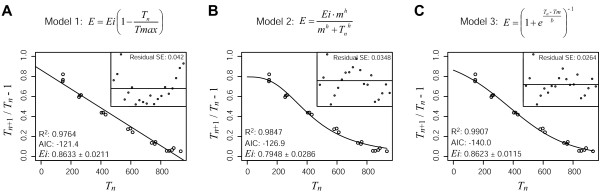
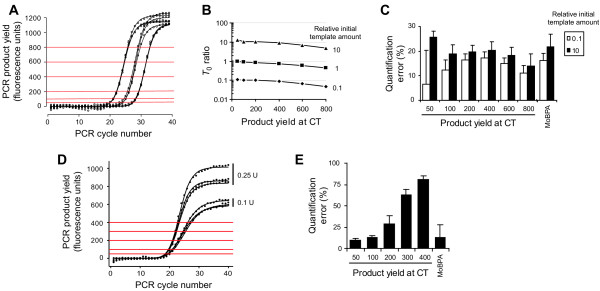
Results: We present here a new mathematical model based on the classic exponential description of the PCR, but modeling amplification efficiency as a sigmoidal function of the product yield. The model was validated with experimental results and used for the development of a new method for real-time PCR data analysis. This model based method for real-time PCR data analysis showed the best accuracy and precision compared with previous methods when used for quantification of in-silico generated and experimental real-time PCR results. Moreover, the method is suitable for the analyses of samples with similar or dissimilar amplification efficiency.

Conclusion: The presented method showed the best accuracy and precision. Moreover, it does not depend on calibration curves, making it ideal for fully automated high-throughput applications.


Figures

Figure 1
Figure 1
Models for PCR amplification efficiency. The effective amplification efficiency for each PCR cycle was calculated as Tn+1 /Tn – 1, where Tn and Tn+1 were the PCR product yield at cycles n and n+1 respectively. Data points are the effective amplification efficiency vs. PCR product yield from a representative PCR reaction performed in triplicate. Lines are the fit of models 1 (A), 2 (B) and 3 (C) to the experimental data. Inserts are the residuals for each fit. The determination coefficient (R2), corrected Akike's Information Criterion (AIC) and the best fit value for Ei ± asymptotic standard error are shown in the graphs. Ei for model 3 was calculated from Eq. (3). Model 1 was fitted by linear regression, while models 2 and 3 were fitted by non-linear regression.
Figure 2
Figure 2
Effect of CT on the initial template amount estimation. (A) Product yield vs. cycle number for the amplification of three serial dilutions (0.1, 1 and 10) of cDNA from mouse midbrain with β-actin specific primers performed in triplicate. Horizontal lines show the values for the product yield at which CT was calculated. (B) Ratios between each T0 determination and T0 estimated for dilution 1 at the smallest CT value. T0 was calculated assuming constant amplification efficiency and using different amounts of PCR product for the estimation of CT values. Data points are the mean for triplicates. (C) Relative error for the quantification of data presented in A. Bars are the relative error of quantification as percentage (mean ± SEM for triplicates). (D) Real-time PCR amplification of the same mouse midbrain cDNA sample with β2 microglobulin specific primers using 0.1 and 0.25 units of Taq DNA polymerase. Horizontal lines show the values for the product yield at which CT was calculated. (E) Relative error for the quantification of data presented in D. Bars are the relative error of quantification as percentage (mean ± SEM for triplicates).
Figure 3
Figure 3
Effect of amplification efficiency over the quantifications performed by different methods. (A) In-silico generated PCR data with initial template amount T0 = 0.001 and different intrinsic amplification efficiencies (Ei) ranging from 0.65 to 0.972 analysed by different methods (see below). Data points represent the base 2 logarithm of the ratio between T0 estimations from each simulated reaction and efficiency 0.8 ones vs. the amplification efficiency bias as mean ± SEM of triplicates. (B) Analysis of experimental results by different methods (see below). Bars represent the error of quantifications as mean ± SEM for triplicates. Bars marked with (*) are under-estimations, conversely, the rest of the bars are over-estimations. Method 6 under-estimated T0 by 737%, note that it is out of scale in the graph. Data was analysed with the CT method assuming constant amplification efficiency equal to 1 {1}; with the CT method assuming constant amplification efficiency equal to 0.8 for in-silico data, or 0.855 for experimental data {2}; assuming constant amplification efficiency that was estimated from two threshold values {3} [15]; using the assumption-free analysis proposed by Ramakers et.al. {4} [13]; using the standardized determination of PCR efficiency from single reaction proposed by Tichopad et.al. {5} [16]; using the sigmoid model proposed by Liu et. al. {6} [17]; and with our model based real-time PCR analysis method (MoBPA) {7}.

References

    1. Rappolee DA, Wang A, Mark D, Werb Z. Novel method for studying mRNA phenotypes in single or small numbers of cells. J Cell Biochem. 1989;39:1–11. doi: 10.1002/jcb.240390102. - DOI - PubMed
    1. Gilliland G, Perrin S, Blanchard K, Bunn HF. Analysis of cytokine mRNA and DNA: detection and quantitation by competitive polymerase chain reaction. Proc Natl Acad Sci USA. 1990;87:2725–2729. doi: 10.1073/pnas.87.7.2725. - DOI - PMC - PubMed
    1. Becker-André M, Hahlbrock K. Absolute mRNA quantification using the polymerase chain reaction (PCR). A novel approach by a PCR aided transcript titration assay (PATTY) Nucleic Acids Res. 1989;17:9437–9447. doi: 10.1093/nar/17.22.9437. - DOI - PMC - PubMed
    1. Wang AM, Doyle MV, Mark DF. Quantitation of mRNA by the polymerase chain reaction. Proc Natl Acad Sci USA. 1989;86:9717–9721. doi: 10.1073/pnas.86.24.9717. - DOI - PMC - PubMed
    1. Alvarez MJ, Depino AM, Podhajcer OL, Pitossi FJ. Bias in estimations of DNA content by competitive polymerase chain reaction. Anal Biochem. 2000;287:87–94. doi: 10.1006/abio.2000.4823. - DOI - PubMed

Publication types

LinkOut - more resources