

Human immunodeficiency virus (HIV-1) Vpr induced downregulation of NHE1 induces alteration in intracellular pH and loss of ERM complex in target cells
- PMID: 17349711
- PMCID: PMC1950453
- DOI: 10.1016/j.virusres.2007.01.019
Human immunodeficiency virus (HIV-1) Vpr induced downregulation of NHE1 induces alteration in intracellular pH and loss of ERM complex in target cells
Abstract
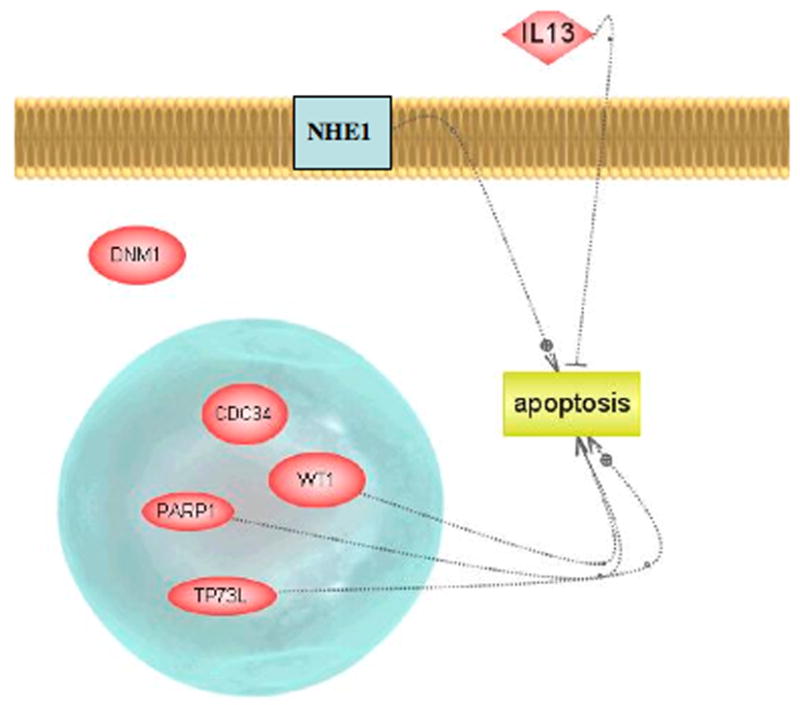
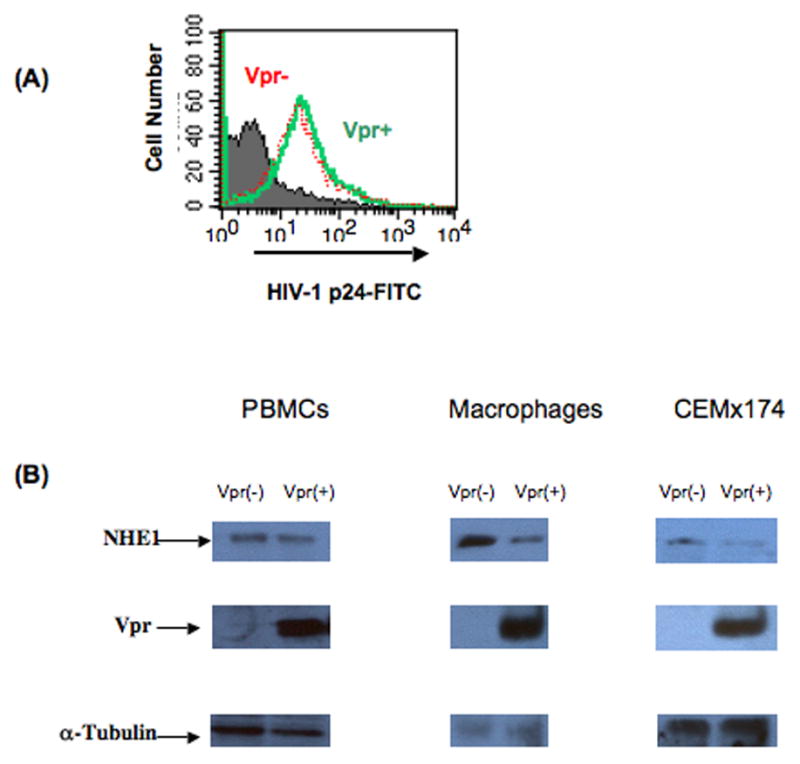
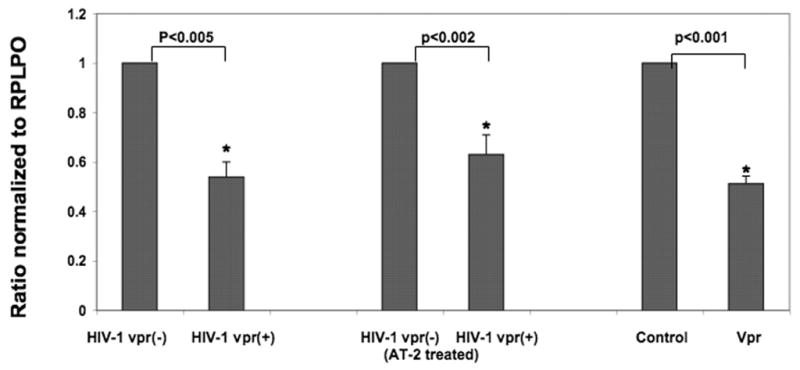
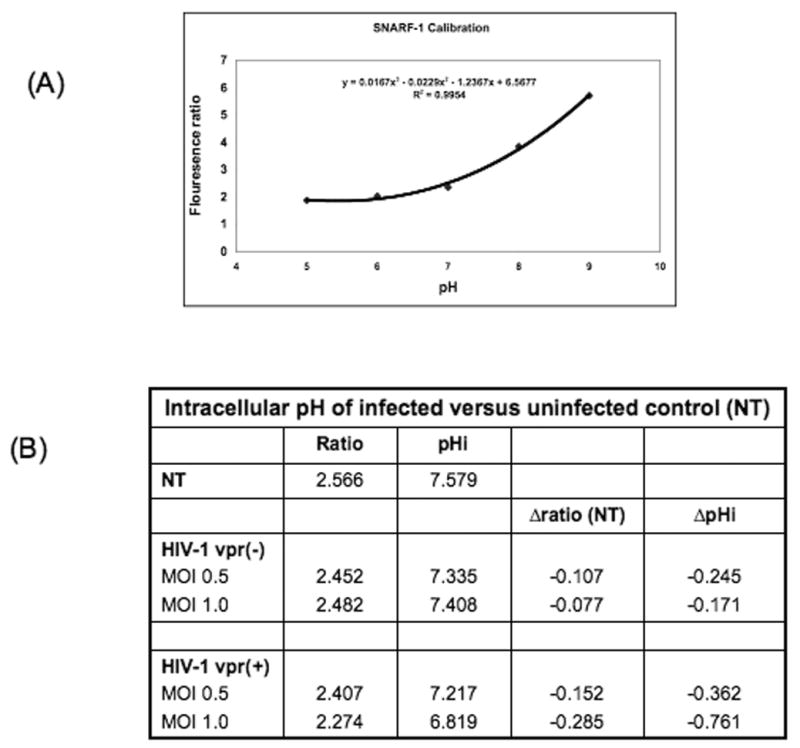
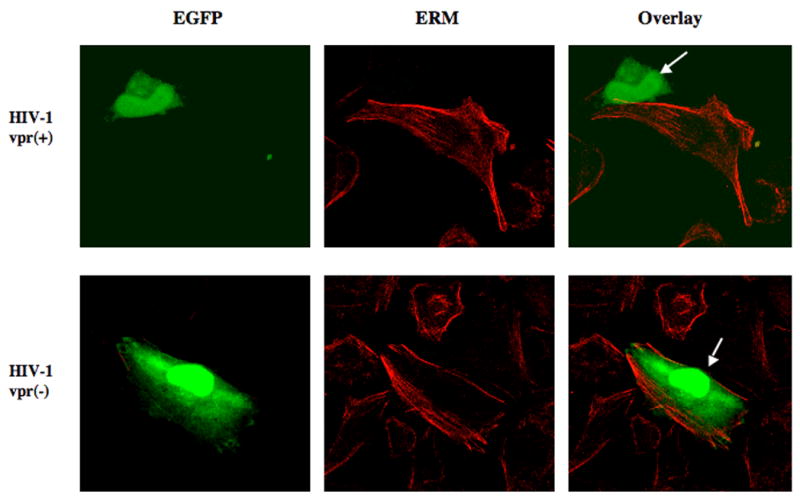
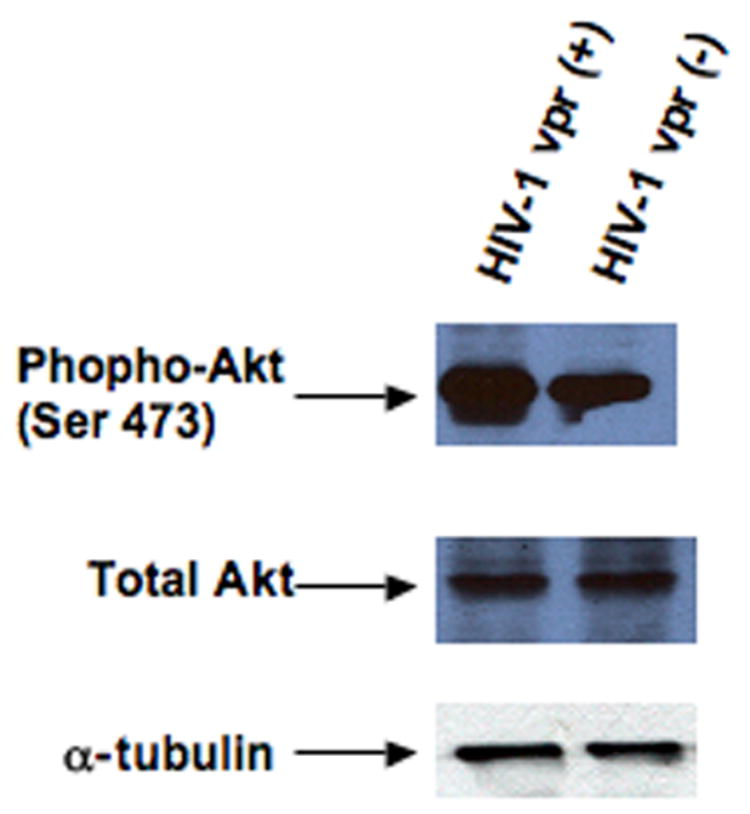
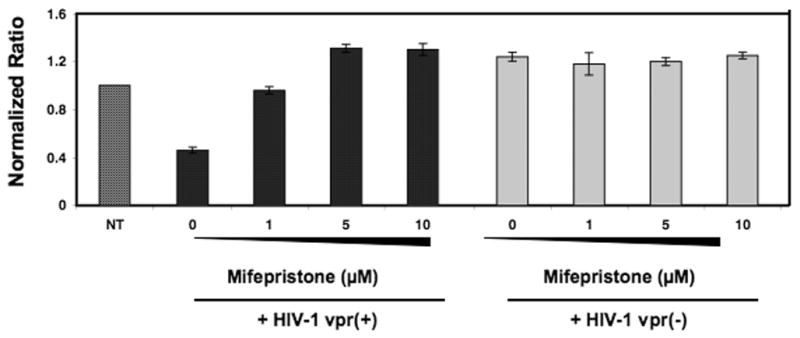
Human immunodeficiency virus type 1 (HIV-1) Vpr is known to dysregulate host cellular functions through its interaction with cellular proteins. Using a protein array we assessed Vpr-mediated differential regulation of host cellular proteins expression. Results demonstrated that Vpr differentially regulated host factors that are involved in functions, such as cell proliferation, differentiation and apoptosis. One of the most highly downregulated proteins attained was the sodium hydrogen exchanger, isoform 1 (NHE1), which showed a significant (60%) decrease in HIV-1 Vpr(+) virus infected cells as compared to HIV-1 Vpr(-) virus infected control. NHE1 downregulation further led to acidification of cells and was directly correlated with loss of ezrin, radixin and moesin (ERM) protein complex and decreased AKT phosphorylation. Vpr-mediated NHE1 dyregulation is in part through GR pathway as GR antagonist, mifepristone reversed Vpr-induced NHE1 downregulation.
Figures
Similar articles
-
Osmotic cell shrinkage activates ezrin/radixin/moesin (ERM) proteins: activation mechanisms and physiological implications.Am J Physiol Cell Physiol. 2008 Jan;294(1):C197-212. doi: 10.1152/ajpcell.00268.2007. Epub 2007 Oct 31. Am J Physiol Cell Physiol. 2008. PMID: 17977945
-
The NHE1 Na+/H+ exchanger recruits ezrin/radixin/moesin proteins to regulate Akt-dependent cell survival.J Biol Chem. 2004 Jun 18;279(25):26280-6. doi: 10.1074/jbc.M400814200. Epub 2004 Apr 19. J Biol Chem. 2004. PMID: 15096511
-
In human T cells mifepristone antagonizes glucocorticoid non-genomic rapid responses in terms of Na(+)/H(+)-exchange 1 activity, but not ezrin/radixin/moesin phosphorylation.Steroids. 2016 Jul;111:29-36. doi: 10.1016/j.steroids.2016.01.004. Epub 2016 Jan 7. Steroids. 2016. PMID: 26773750
-
Viral protein R of HIV-1.Rev Med Virol. 1999 Jan-Mar;9(1):39-49. doi: 10.1002/(sici)1099-1654(199901/03)9:1<39::aid-rmv235>3.0.co;2-3. Rev Med Virol. 1999. PMID: 10371671 Review.
-
The role of Vpr in HIV-1 pathogenesis.Curr HIV Res. 2005 Jan;3(1):43-51. doi: 10.2174/1570162052772988. Curr HIV Res. 2005. PMID: 15638722 Review.
Cited by
-
The Ezrin-radixin-moesin family member ezrin regulates stable microtubule formation and retroviral infection.J Virol. 2008 May;82(9):4665-70. doi: 10.1128/JVI.02403-07. Epub 2008 Feb 27. J Virol. 2008. PMID: 18305045 Free PMC article.
-
Sphingolipid regulation of ezrin, radixin, and moesin proteins family: implications for cell dynamics.Biochim Biophys Acta. 2014 May;1841(5):727-37. doi: 10.1016/j.bbalip.2013.07.002. Epub 2013 Jul 12. Biochim Biophys Acta. 2014. PMID: 23850862 Free PMC article. Review.
-
The taming of a scramblase.J Gen Physiol. 2021 Apr 5;153(4):e202012831. doi: 10.1085/jgp.202012831. J Gen Physiol. 2021. PMID: 33661279 Free PMC article.
-
Regulation of cell survival by Na+/H+ exchanger-1.Am J Physiol Renal Physiol. 2008 Sep;295(3):F625-32. doi: 10.1152/ajprenal.90212.2008. Epub 2008 May 14. Am J Physiol Renal Physiol. 2008. PMID: 18480176 Free PMC article. Review.
-
Interactions of host proteins with the murine leukemia virus integrase.Viruses. 2010 May 5;2(5):1110-45. doi: 10.3390/v2051110. Viruses. 2010. PMID: 21637732 Free PMC article.
References
-
- Alimonti JB, Ball TB, Fowke KR. Mechanisms of CD4+ T lymphocyte cell death in human immunodeficiency virus infection and AIDS. J Gen Virol. 2003;84(Pt 7):1649–61. - PubMed
-
- Andersen JL, Zimmerman ES, DeHart JL, Murala S, Ardon O, Blackett J, Chen J, Planelles V. ATR and GADD45alpha mediate HIV-1 Vpr-induced apoptosis. Cell Death Differ. 2005;12(4):326–34. - PubMed
-
- Arunagiri C, Macreadie I, Hewish D, Azad A. A C-terminal domain of HIV-1 accessory protein Vpr is involved in penetration, mitochondrial dysfunction and apoptosis of human CD4+ lymphocytes. Apoptosis. 1997;2(1):69–76. - PubMed
-
- Azad AA. Could Nef and Vpr proteins contribute to disease progression by promoting depletion of bystander cells and prolonged survival of HIV-infected cells? Biochem Biophys Res Commun. 2000;267(3):677–85. - PubMed
Publication types
MeSH terms
Substances
Grants and funding
LinkOut - more resources
Full Text Sources
Research Materials
Miscellaneous
