. 2007 Apr;42(4):812-25.
doi: 10.1016/j.yjmcc.2007.01.010. Epub 2007 Jan 31.

Cardioprotection and mitochondrial S-nitrosation: effects of S-nitroso-2-mercaptopropionyl glycine (SNO-MPG) in cardiac ischemia-reperfusion injury

Affiliations

Cardioprotection and mitochondrial S-nitrosation: effects of S-nitroso-2-mercaptopropionyl glycine (SNO-MPG) in cardiac ischemia-reperfusion injury

Sergiy M Nadtochiy et al. J Mol Cell Cardiol. 2007 Apr.

Abstract

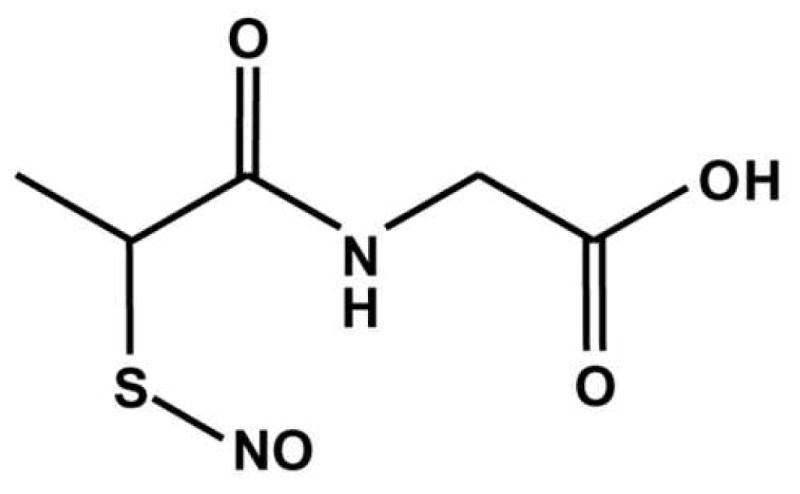
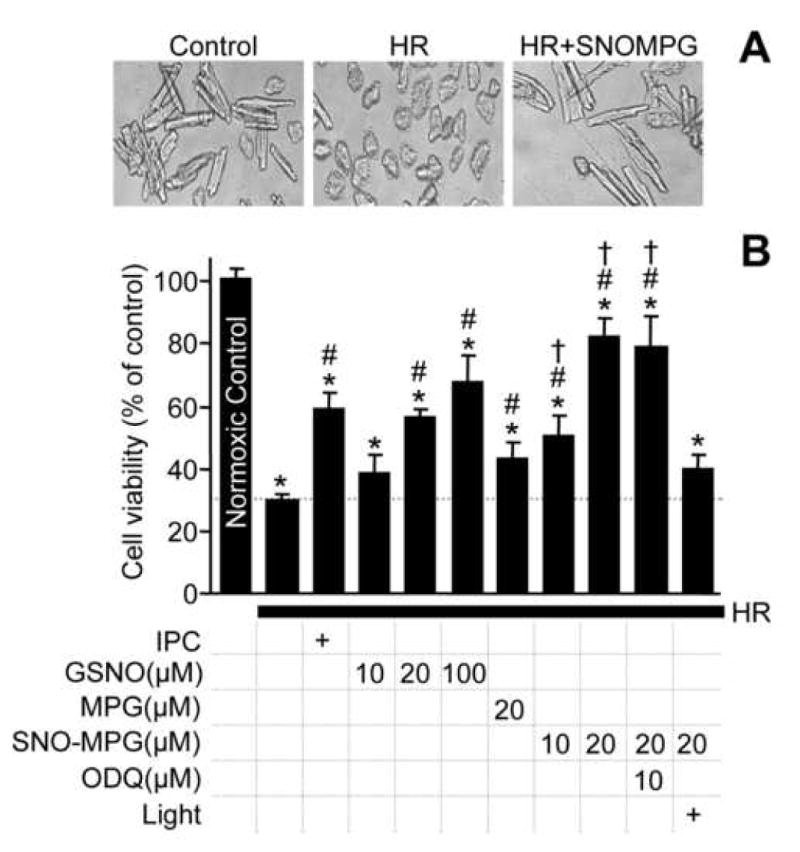
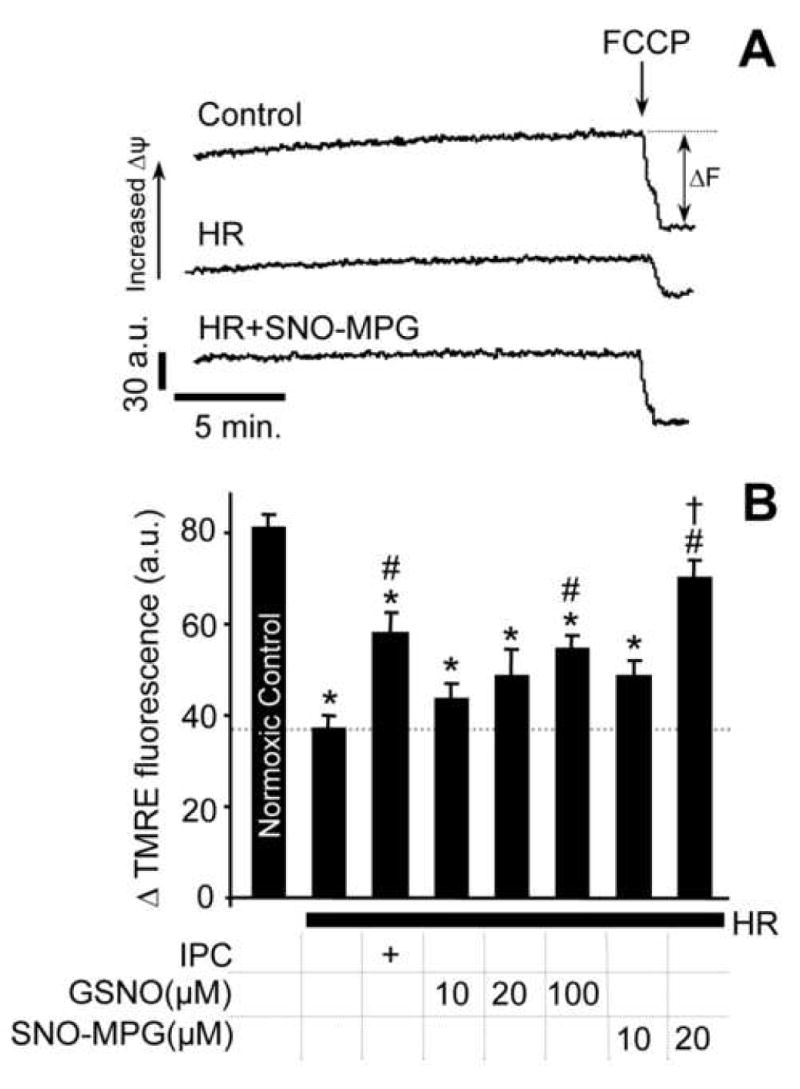
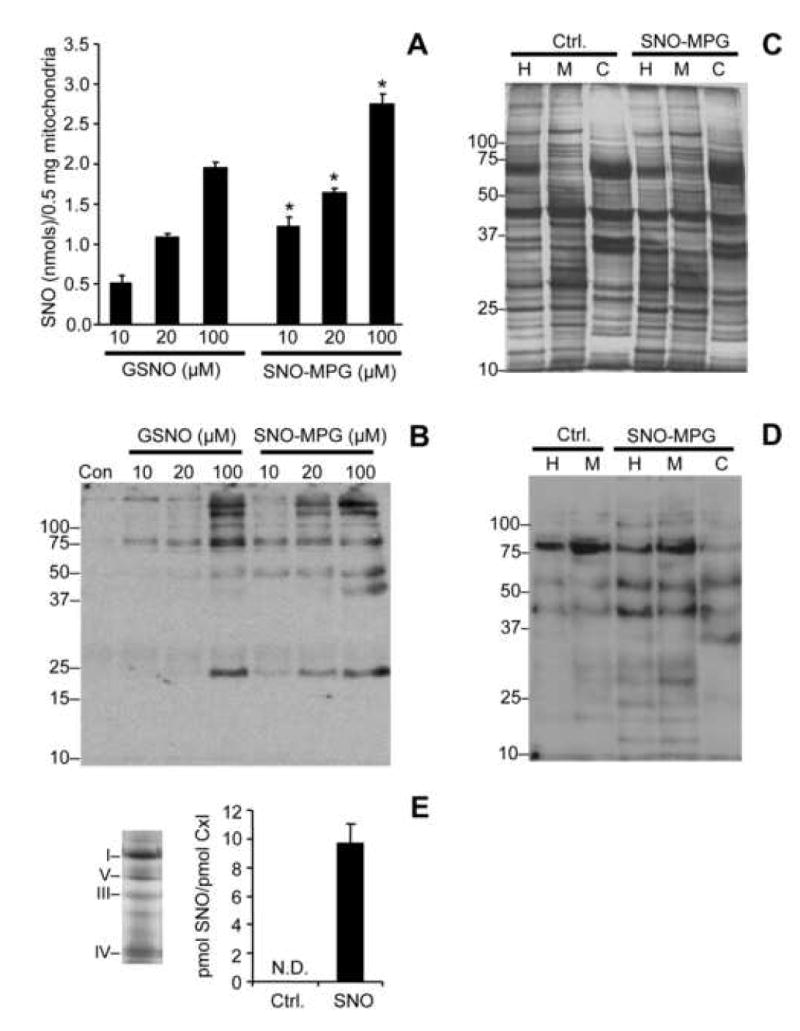
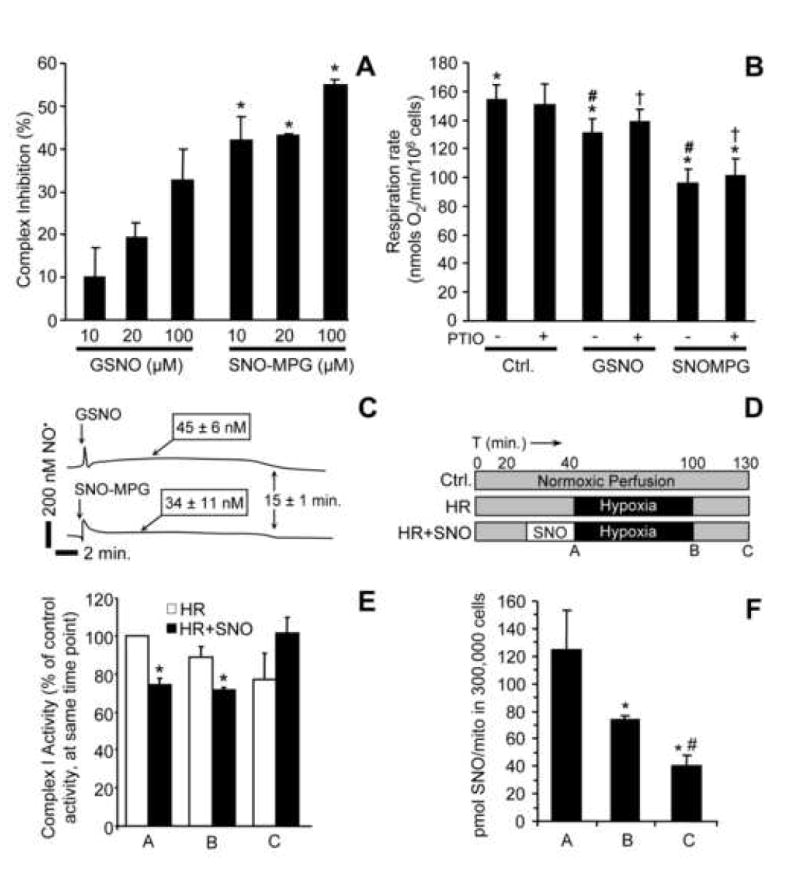
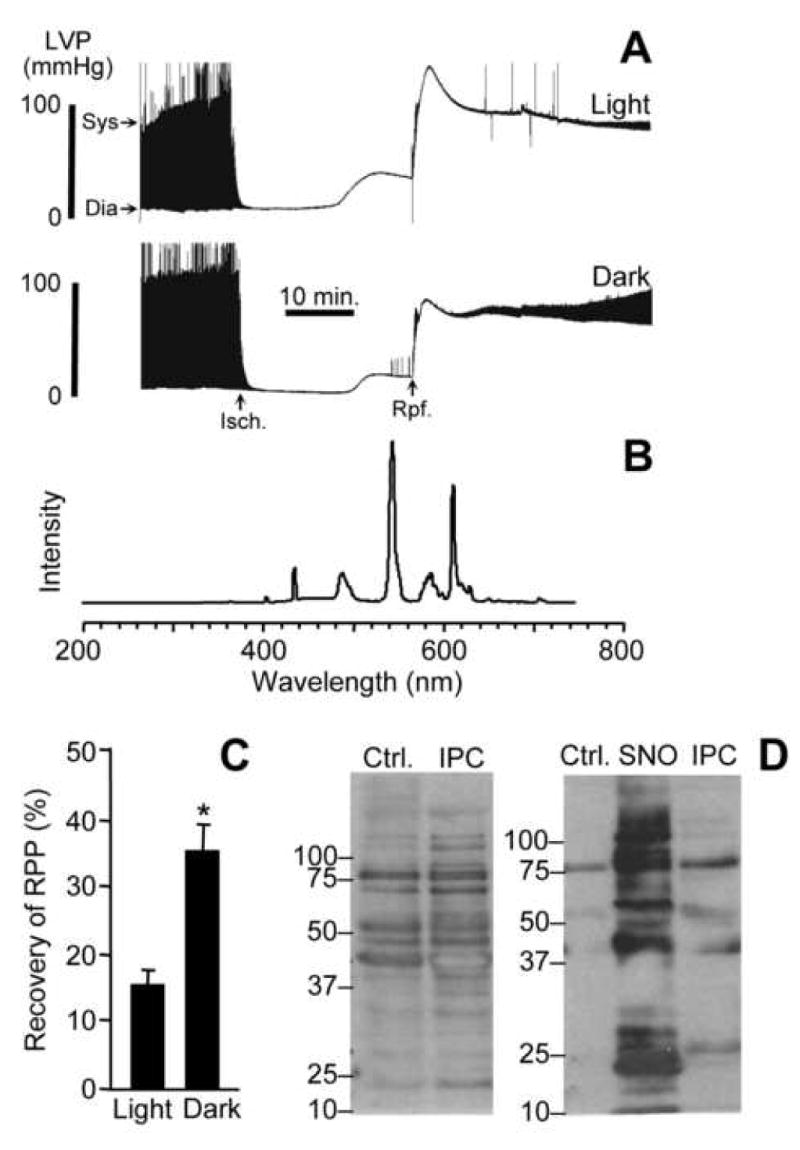
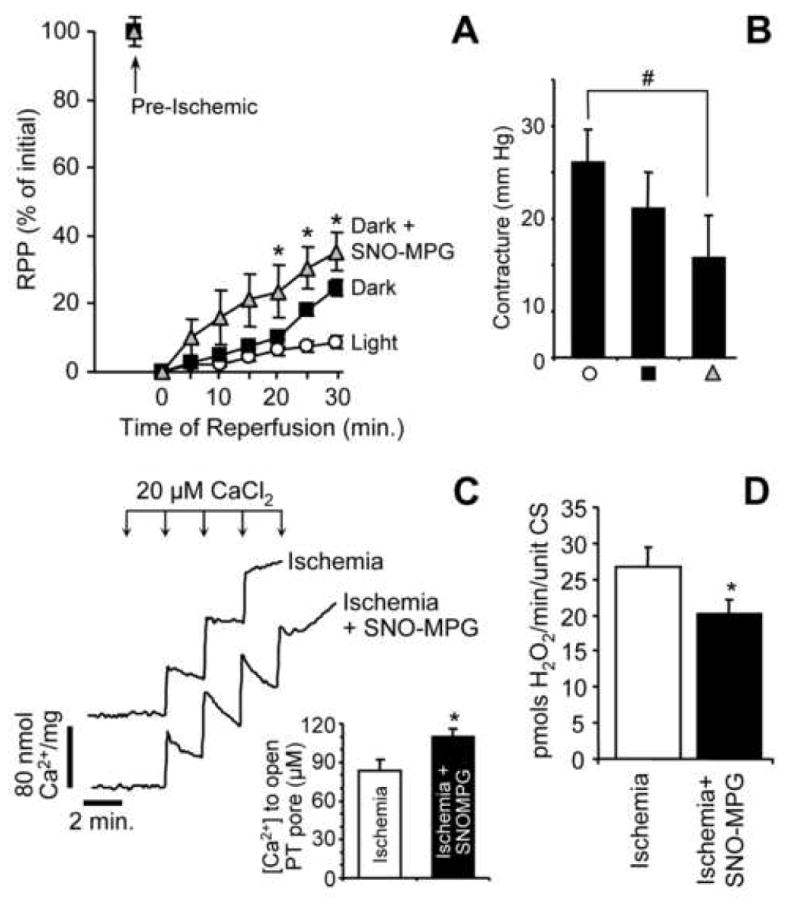
Mitochondrial dysfunction is a key pathologic event in cardiac ischemia-reperfusion (IR) injury, and protection of mitochondrial function is a potential mechanism underlying ischemic preconditioning (IPC). Acknowledging the role of nitric oxide (NO()) in IPC, it was hypothesized that mitochondrial protein S-nitrosation may be a cardioprotective mechanism. The reagent S-nitroso-2-mercaptopropionyl-glycine (SNO-MPG) was therefore developed to enhance mitochondrial S-nitrosation and elicit cardioprotection. Within cardiomyocytes, mitochondrial proteins were effectively S-nitrosated by SNO-MPG. Consistent with the recent discovery of mitochondrial complex I as an S-nitrosation target, SNO-MPG inhibited complex I activity and cardiomyocyte respiration. The latter effect was insensitive to the NO() scavenger c-PTIO, indicating no role for NO()-mediated complex IV inhibition. A cardioprotective role for reversible complex I inhibition has been proposed, and consistent with this SNO-MPG protected cardiomyocytes from simulated IR injury. Further supporting a cardioprotective role for endogenous mitochondrial S-nitrosothiols, patterns of protein S-nitrosation were similar in mitochondria isolated from Langendorff perfused hearts subjected to IPC, and mitochondria or cells treated with SNO-MPG. The functional recovery of perfused hearts from IR injury was also improved under conditions which stabilized endogenous S-nitrosothiols (i.e. dark), or by pre-ischemic administration of SNO-MPG. Mitochondria isolated from SNO-MPG-treated hearts at the end of ischemia exhibited improved Ca(2+) handling and lower ROS generation. Overall these data suggest that mitochondrial S-nitrosation and complex I inhibition constitute a protective signaling pathway that is amenable to pharmacologic augmentation.


Figures

Figure 1
Figure 1. Chemical structure of SNO-MPG
Figure 2
Figure 2. Effect of SNO-MPG on cardiomyocyte viability, in simulated IR injury
Cardiomyocyte isolation and incubations were performed as detailed in the methods. Isolated cardiomyocytes were subjected to preconditioning (IPC) or pharmacological treatment with GSNO or SNO-MPG, prior to hypoxia-reoxygenation (HR) injury. (A): Representative photomicrographs showing typical morphological changes in cardiomyocytes subjected to HR, compared to control and SNO-MPG (20 μM) treated cells. (B): Cell viability (Trypan blue exclusion) measured at the end of reoxygenation. Experimental conditions are listed below the x-axis. ODQ = soluble guanylate cyclase inhibitor. Data are means ± SEM of at least 5 independent experiments. *p<0.05 vs. control, #p<0.05 vs. HR, †p<0.05 between matching concentrations of SNO-MPG and GSNO.
Figure 3
Figure 3. Effect of SNO-MPG on cardiomyocyte mitochondrial function, in simulated IR injury
Cardiomyocyte isolation and incubations were performed as detailed in the methods. Isolated cardiomyocytes were subjected to preconditioning (IPC) or pharmacological treatment with GSNO or SNO-MPG, prior to hypoxia-reoxygenation (HR) injury. (A): Representative TMRE fluoresence traces for determination of mitochondrial membrane potential (Δψm) in cardiomyocytes from the control, HR, and HR plus SNO-MPG (20 μM) groups. ΔF represents difference before and after FCCP (5 μM) addition. (B): Average ΔTMRE fluorescence (a.u. = arbitrary units). Experimental conditions are listed below the x-axis. In panels B and D, all data are means ± SEM of at least 5 independent experiments. *p<0.05 vs. control, #p<0.05 vs. HR, †p<0.05 between matching concentrations of SNO-MPG and GSNO.
Figure 4
Figure 4. S-nitrosation of isolated mitochondria and mitochondria inside cells by SNO-MPG
(A): Mitochondria were treated with GSNO or SNO-MPG at the concentrations given on the x-axis, as detailed in the methods. SNO content of mitochondrial pellets was determined by chemiluminescence analysis as described in the methods. Data are means ± SEM of at least 4 independent experiments. *p<0.01 between GSNO and SNO-MPG at the same concentration. No SNO was detected in un-treated controls (Cf. Table 1). See also Table 1 for other SNO metabolites. (B): Mitochondrial S-nitrosation was analyzed using the biotin-switch method (see methods). Bands in the control lane of the western blot (Con) are indicative of endogenous mitochondrial biotin-containing proteins (e.g. decarboxylases). Other bands represent peptides that were S-nitrosated by GSNO or SNO-MPG treatment. Blot is representative of at least 3 independent experiments, and numbers to the left are molecular weight markers (kDa). (C/D): Cardiomyocytes were incubated as detailed in the methods, in the absence (Ctrl.) or presence (SNO) of 20 μM SNO-MPG for 20 min. Mitochondria were then isolated from the cells (see methods) and the total cell homogenate (H), isolated mitochondria (M), and cytosol (C) were analyzed by the biotin-switch method. Panel C shows a typical Coomassie-stained gel following separation of peptides by SDS-PAGE. Panel D shows a biotin-switch western blot. Both blot and gel are representative of at least 3 independent experiments, and numbers to the left are molecular weight markers (kDa). (E): S-nitrosation of complex I inside cardiomyocytes. Mitochondria were isolated from cells treated with SNO-MPG as above, and respiratory complexes separated by blue-native gel [27]. Left panel shows a representative gel, with positions of complexes indicated by Roman numerals. Right panel shows the SNO content (ozone chemiluminescence) of complex I excised from the gels. Data are means ± standard deviation of 2 independent experiments. N.D. = not detectable (i.e. below limit of detection of apparatus).
Figure 5
Figure 5. Inhibition of complex I and respiration by S-nitrosothiols
(A): Isolated mitochondria (0.5 mg) were incubated with GSNO or SNO-MPG (10, 20 or 100 μM) for 20 min. Complex I activity was then measured as detailed in the methods. Data are means ± SEM of at least 3 independent experiments *p<0.02 between GSNO and SNO-MPG groups. (B): Cardiomyocytes were treated with SNO-MPG or GSNO, and their respiration rates determined as detailed in the methods. In certain incubations, the NO scavenger PTIO was added to reverse NO mediated inhibition of respiratory complex IV (cytochrome c oxidase). Significant differences (p<0.05) exist between groups with the same symbols (*, #, †). (C): NO release by SNOs was monitored using a polarographic NO electrode in a typical cardiomyocyte incubation (5 × 10⁵ cells / 5 ml). SNO-MPG or GSNO were added at 20 μM, and [NO] followed for 20 min. Steady-state NO levels (means ± SEM, N>3) are indicated above the traces. (D): Protocol for cell HR experiments, indicating times (ABC) of mitochondrial isolation for complex I assays and SNO measurement. (E): Complex I activity at time points A, B, C during HR protocol. Rates from the HR and HR + SNO groups are expressed as percentages of the rate in normoxic controls. (F): SNO levels in mitochondria from the HR + SNO treatment group, as in panels D and E. Under no conditions was SNO detectable in the HR alone or normoxic samples (not shown). Data in panels E and F are means ± SEM of at least 3 independent experiments.
Figure 6
Figure 6. Endogenous S-nitrosothiols, cardioprotection, & effects of light
(A): Langendorff perfused hearts were subject to 25 min. ischemia and 30 min. reperfusion as described in the methods. Typical recordings of left ventricular pressure (LVP) are shown, with the time axis compressed, such that the upper and lower boundaries of the black shaded areas represent the boundaries of systolic (Sys) and diastolic (Dia) pressures, as indicated by the arrows. The times of onset of ischemia and reperfusion are indicated by “Isch” and “Rpf” arrows respectively. (B): Ambient laboratory light spectrum at the site of the heart in the Langendorff perfusion apparatus. (C): Post-IR recovery of rate pressure product (RPP, heart rate multiplied by LV developed pressure (systolic minus diastolic)), for hearts subjected to IR in light vs. dark conditions. Values were calculated from traces of the type shown in panel A, and are expressed as percentage of the pre-ischemic RPP value. Data are means ± SEM of at least 5 independent experiments. *p<0.05 between groups. (D): Biotin switch analysis. Left panel: mitochondria isolated from hearts that underwent normoxic perfusion (Ctrl), or IPC followed by ischemia only (no reperfusion). Right panel: as in left panel, with inclusion of a sample of mitochondria treated with SNO-MPG (cf. Fig. 4). All procedures including mitochondrial isolation were performed in the dark, as detailed in the methods. Blots are representative of at least 3 independent experiments, and numbers to the left are molecular weight markers (kDa).
Figure 7
Figure 7. Effect of SNO-MPG on cardiac recovery from IR injury, and on mitochondrial pathologic parameters at the end of ischemia
(A): Heart perfusions were performed as described in the methods, and post-IR recovery of RPP is expressed as a percentage of the pre-ischemic level within each group. Experimental treatments were: control in the light (open circles), control in the dark (black squares), SNO-MPG in the dark (gray triangles). SNO-MPG was perfused at 10 μM for 20 min. prior to ischemia. Data are means ± SEM for at least 5 independent experiments. *p<0.05 between dark, and dark plus SNO-MPG groups. (B): Magnitude of hypercontracture sustained during ischemia, in each of the 3 groups shown in Panel A (same symbols). Hypercontracture was defined as the mean diastolic pressure during the final 5 min. of ischemia, minus the mean diastolic pressure during the first 10 min. of ischemia (see panel 6A). #p<0.05 between groups indicated. (C): Effect of SNO-MPG treatment prior to ischemia on Ca2+ handling properties of mitochondria isolated at the end of ischemia. Typical Arsenazo III traces for mitochondria from control vs. SNO-MPG treated hearts are shown. Inset shows the amount of added Ca2+ required for PT pore opening to occur (indicated in the traces by a failure of mitochondria to take up and hold Ca2+, resulting in its release and an upwards deflection in the trace). Data in inset are means ± SEM of 4 independent experiments. (D): Effect of SNO-MPG treatment prior to ischemia on ROS generation by mitochondria isolated at the end of ischemia. ROS generation was measured in the presence of complex I linked substrates (glutamate plus malate), using the Amplex red reagent as detailed in the methods. Data are means ± SEM of 4 independent experiments.

References

    1. Brookes PS, Yoon Y, Robotham JL, Anders MW, Sheu SS. Calcium, ATP, and ROS: a mitochondrial love-hate triangle. Am J Physiol Cell Physiol. 2004;287:C817–C833. - PubMed
    1. Hausenloy DJ, Yellon DM. The mitochondrial permeability transition pore: its fundamental role in mediating cell death during ischaemia and reperfusion. J Mol Cell Cardiol. 2003;35:339–41. - PubMed
    1. Crompton M. The mitochondrial permeability transition pore and its role in cell death. Biochem J. 1999;341:233–49. - PMC - PubMed
    1. Di Lisa F, Bernardi P. Mitochondria and ischemia-reperfusion injury of the heart: Fixing a hole. Cardiovasc Res. 2006;70:191–9. - PubMed
    1. Murry CE, Jennings RB, Reimer KA. Preconditioning with ischemia: a delay of lethal cell injury in ischemic myocardium. Circulation. 1986;74:1124–36. - PubMed

Publication types

MeSH terms